Myanmar Dried Fish Consumption Survey
Introduction
Background
Throughout Asia, most people consume dried fish, and it is of vital nutritional, economic, social, and cultural importance. Dried fish products are particularly important for poor and vulnerable people as it is some of the cheapest and most widely available nutritious food. Furthermore, as dried fish is preserved, it can be consumed in areas or at times of the year when little fresh fish is available. Large numbers of poor people, especially women, are involved in the processing and trade of dried fish. However, there are also several challenges, including poor working conditions and poor food safety (e.g. use of pesticides during drying and storage to prevent pest infestations). The diverse and complex economy of dried fish production and distribution in Southeast Asia is often overlooked in the research and policy arena.
The Myanmar Dried Fish Consumption Survey (MDFCS) is being implemented by NAG as part of the Dried Fish Matters (DFM) project. The DFM project is being implemented in Cambodia, Thailand, Myanmar, Bangladesh, India and Sri Lanka by a network of partners, led by the University of Manitoba (Canada) [1].
Objectives
The purpose of the MDFCS is to understand different patterns of dried fish consumption in Myanmar. To our knowledge, this will be the first study to explore this topic. Dried fish consumption patterns are likely to vary across the country in terms of quantity and types of consumed products. Implementing the survey in all states and regions of Myanmar where NAG has offices will allow us to make comparisons between these regions.
The MDFCS is conducted as part of the Phase I baseline in Myanmar. As there are limited data available on dried fish consumption in the country, the survey intends to capture the general consumption data and behavior patterns in the country. Since the resources to gather a representative dataset for the country are limited and the process can an extensive holistic research, the survey has been designed to identify the common consumption patterns from eight states and regions where NAG offices are located.
Scope
This study confines to the 8 states and regions in Myanmar where NAG offices are located. The data collection was taken between October 2019 and March 2020. The participants in this study were rural people who are living under the scope of NAG project villages. This study mainly focuses on fish (fresh and processed) consumption in the 7 days before the survey and per capita consumption per day, including the source of the consumed fish, location of purchase, method of consumption, and details of the consumed fish species.
Survey Locations
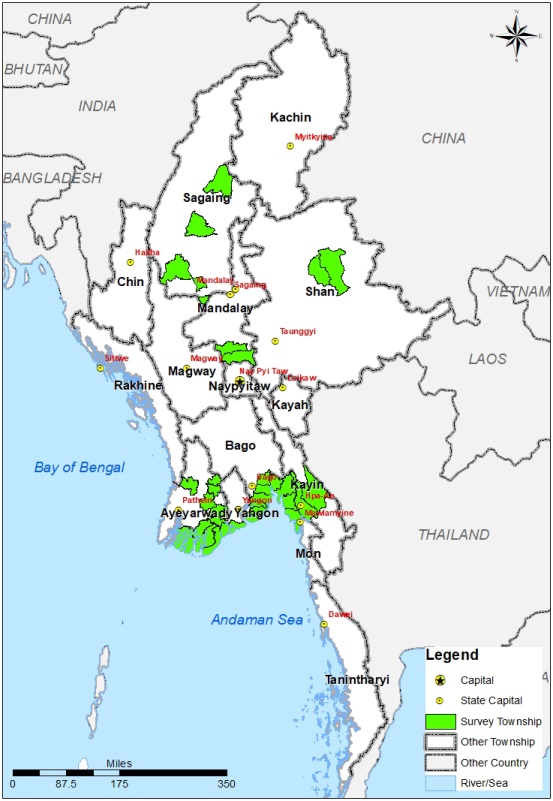
Figure 1 provides a summary of the survey locations in Myanmar where consumers were interviewed.
The study areas cover the three geographical zones of Myanmar, the Delta and Coastal Region, the Dry Zone, and the Hilly Region. The well-known places for fish production as Ayeyarwady, Yangon and Bago Regions are in the Delta and Coastal Region. Mandalay and Sagaing Regions are in the Dry Zone, and Northern Shan and Kayin States are located in the Hilly Region.
Structure of the report
This report is organized into five distinct sections. Section 2 provides methodology of the survey and sampling method. It was followed by literature review on significant of dried fish in Myanmar, and descriptions of the different processed fish in the country. The section 5 details the findings on quantity of consumed fresh and processed fish within seven days, per capita consumption, and sources of consumed fish. In the last section, the most relevant findings will be discussed.
Methodology
The study is a quantitative study that intends to calculate the type and amount of dried fish and fish products consumed by a family, and to identify their consumption behaviors based on their locations. The survey is a formal type of a close-ended questionnaire survey involving face-to-face interviews with households from the selected study areas.
Questionnaire design
The questionnaire is prepared based on the common consumption survey format with the dried fish products that are well known in Myanmar. However, there is an option for other expected types fish products that may occur.
The questionnaire was designed to be simple and easy to answer so that NAG field staff can conduct it without causing significant disruption to their daily work. The questionnaire was divided into seven components for each type of fish, as shown in figure 2. In this survey, we focused on eight categories of fish (fresh and processed).
Sampling design
The total numbers of 1,100 households were selected from the targeted six regions and three states, where NAG operates (Annex 1.1). Different states and regions were purposively chosen based on their geographic locations because it is believed that their consumptions behaviors and patterns around dried fish may differ based on the availability of dried fish products, and their locations, cultures, traditions, and ethnicities.
Magway was excluded during the survey for feasibility of the field management especially with Covid-19 precautions. Thus, there was a total of 960 households participated in the survey. Although the survey does not intend to represent the whole country, the randomly chosen households from each states and regions provide generalizable consumption data of their respective states and regions.
Data Collection and analysis
Data collection was undertaken by NAG field staff from October 2019 to March 2020 using KoBo Toolbox application during their regular visit to the project’s villages. All the collected data were stored on the KoBo server. After compiling and cleaning the data, an analysis was carried out using Microsoft Excel 2010.
Methodological Limitations
The employment of convenient sampling method for the consumption limits the generalizability and the interpretation of data. The selected households from Ayeyarwady, Mon and Bago mostly involved in the fisheries projects while the households from Sagaing and Mandalay were probably from the agriculture and infrastructure projects, and the households from the Northern Shan State might involve in the women’s empowerment project.
In person training for the interviewers was not conducted due to resource constraints, but using a simple tool like KoBo Toolbox[2] and previous experience of the field staffs allowed to deploy the survey effectively only with a survey guidance note provided. Due to the outbreak of the COVID-19 pandemic, Magway region was excluded from the intended nine states and regions since the data collection process was postponed.
Per capita consumption rates are estimations derived from the general population, including both consumers and non-consumers. Thus, per capita rates are primarily useful for trend analysis, rather than representing actual consumption.
Sources of fish is based on households reporting consuming product by source with recognition that sum can be different to 100% as household can obtain any category of fish from multiple sources, or cannot consume.
Significance of dried fish
Myanmar’s national average consumption of fish and fish products is 21kg per capita per year determined by Household Income and Expenditure Survey conducted in 2006 [3]. It represents 22.6% of total dietary protein consumption, and includes 31.5% of inland species consumption and 23.5% marine species. Fish paste, fish sauce, shrimp paste and dried fish are mostly consumed. Fermented fish paste (Ngapi) is the most commonly consumed fish product.
A typical meal of a farming households in the Dry Zone is a big portion of rice with chickpeas and fish paste, in some cases together with vegetables [4]. This meal is consumed at least twice per day. In contrast, meat is usually consumed 1-3 days a week, and in small portions. Dry fish is eaten in small portions, on an almost daily basis.
An average of 6.5kg/capita of dried and processed fish products were consumed annually according to a review of fish consumption patterns from a nationally representative household survey conducted in Myanmar in 2010 [5]. These accounted for 34% of all fish consumption – more than consumption of fresh fish from freshwater capture fisheries (27%), farmed fish (21%), and fresh marine fish (18%). Dried/processed fish are consumed in almost equal quantities in rural and urban areas, and consumption per capita of these products by the wealthiest 20% of the population is proximately double that found among the poorest 20% of households. This indicates that in Myanmar dried fish is not an inferior good (consumption does not decline with rising income). Belton et al. [6] find that fermented fish/shrimp products are by far the cheapest animal source food other than milk, consumption of which was negligible. The unit price of dried fish is more than double that of fresh fish, but this price differential reflects water loss during the drying process, which makes it a concentrated source of nutrients, representing good value for money despite the high nominal price.
Negative health outcomes of dried fish consumption, which may disproportionately affect poorer consumers, is suggested by Naing & Aung [7]. They state that “salted fish paste is essential for us. Though it may increase blood pressure, it is cheap and hence, we, as poor people, have to eat it.”
Different types of processed fish
Dried fish (Nga-chauk)
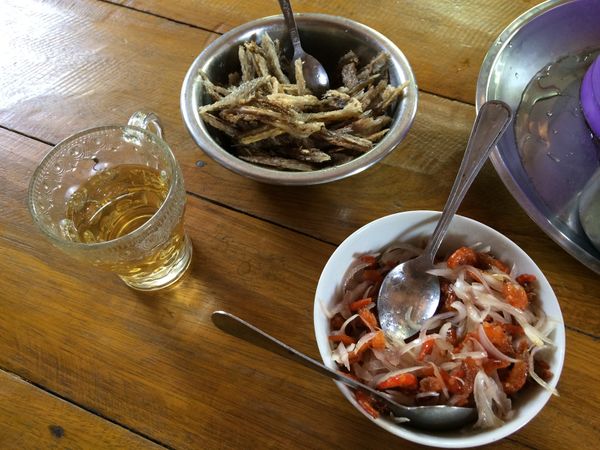
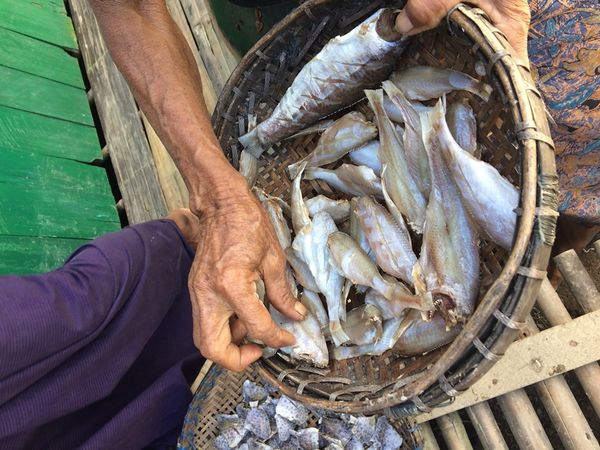
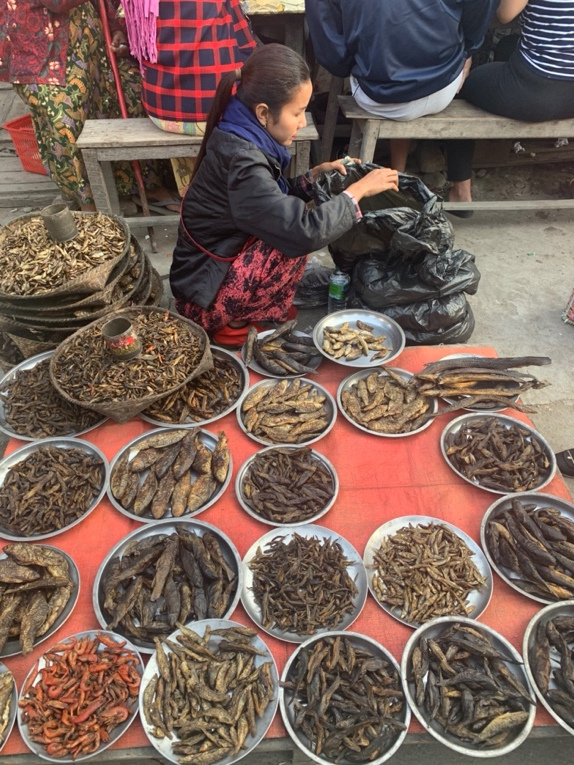
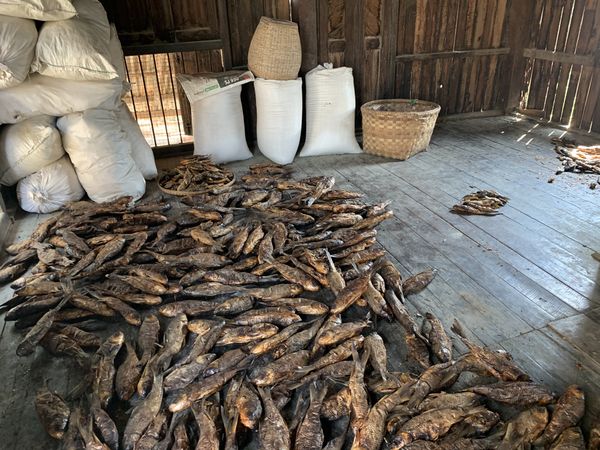
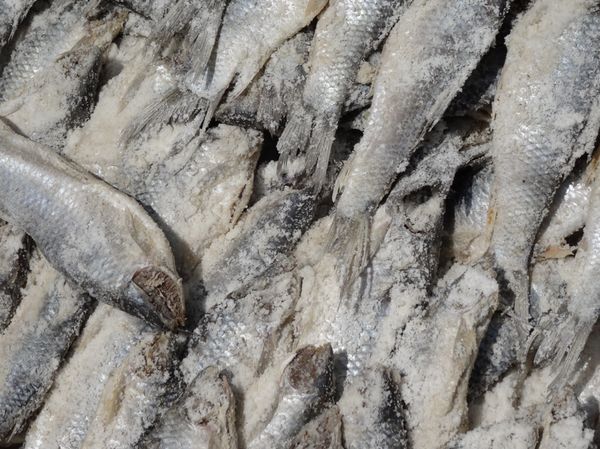
Dried fish (Nga-chauk) is a stable food source for Myanmar regardless of their socioeconomic status. There are many quality grades and methods of processing based on regions and seasonality. Normally, fish are cleaned and salt is added before leaving for an overnight. Salted fish are sometimes washed with water before drying. Different methods of cooking and preparing are applied based on the types of dried fish or shrimp (Pa-zun-chauk). Some are eaten with peanut oil, some are fried or cooked, and some are used as a seasoning. Ba-la-chaung, deep fried dried fish or shrimp with onion, garlic, and chilies, is a common quick side dish that can be stored for a long time.
Major varieties of dried fish come from marine fish; however, freshwater fish snakehead catfish is one of the most preferable dried fish in the country. Dried snakehead catfish (Nga-yant-chauk) is mostly grilled and prepared to eat alone with peanut oil. It is also preferable to cook with vegetables as a curry.
Dried shrimp (Pa-zun-chauk)
While most of dried fish and smoked fish are a main ingredient for Myanmar cuisine, dried shrimp, fish paste and shrimp paste are also considered as a seasoning ingredients or taste enhancer in preparing salads, side dish, soup, and main curries.
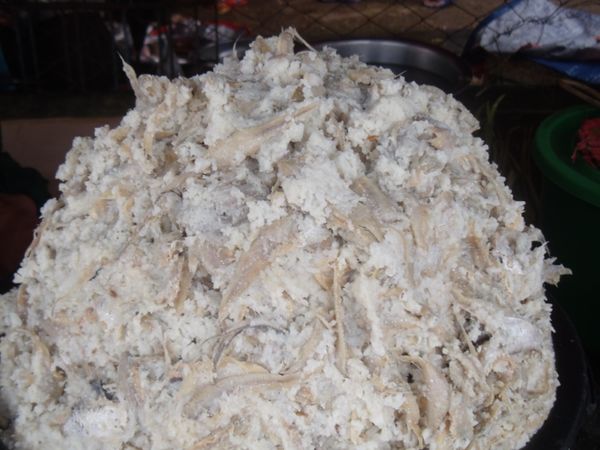
Dried shrimp (Pa-zun-chauk) varies in size, drying method, seasons, and regions. It is used as powder or a whole.
Smoked fish (Nga-jat-taik)
Smoked fish (Nga-jat-taik) are normally processed with freshwater fish. The traditional smoked fish in the Hilly Region (Shan, Chin and Kachin) is to preserve the fish that was caught in the wild. It used small indigenous species (SIS). Later aquaculture fish like Rohu (especially small size) is used to be smoked commercially and marketed in the Hilly region.
Fish or shrimp paste (Nga-pi) and fish sauce (Ngan-pyar-yay)
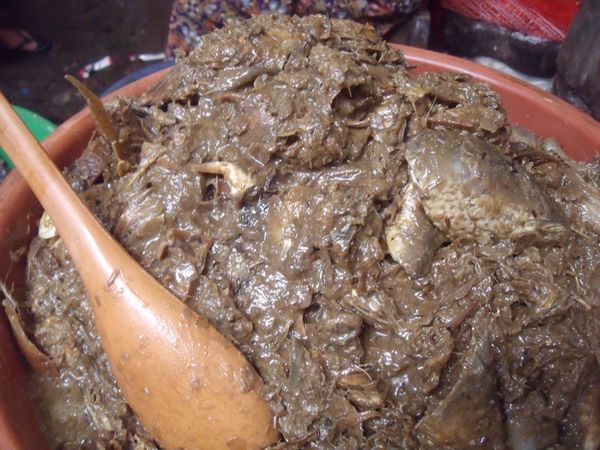
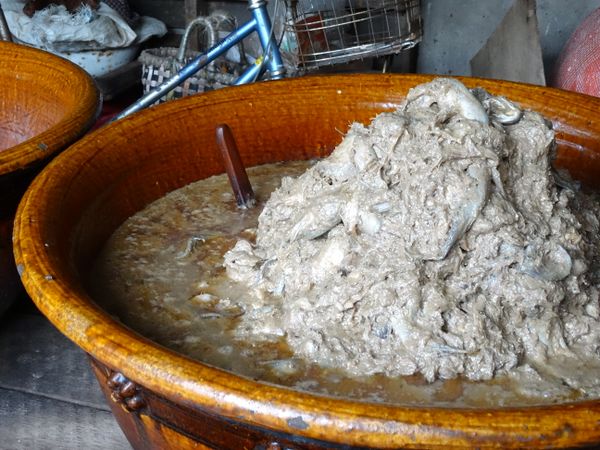
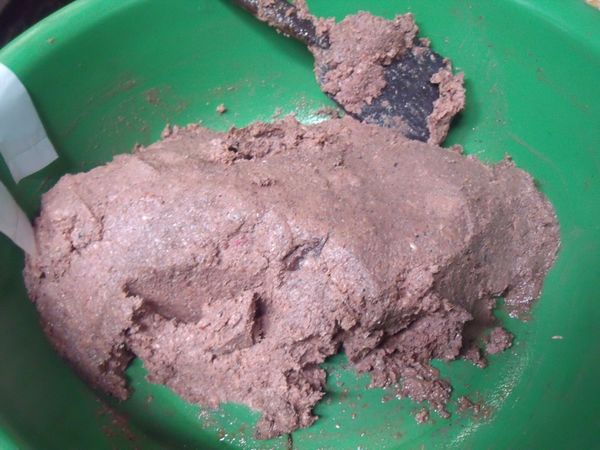
Fish or shrimp paste (Nga-pi) is the most common fermented product and is usually made by fermenting process. It possesses pungent smell, and considered as a national pride. It can be made either from freshwater or marine fish, whereas shrimp paste is always made with marine species, and the product is called as Myin-nga-pi.
The common process of fish fermentation digested the fish to become the form of the fish is no longer discernible [8]. Fish paste is typically made from small fish, some are used whole and some are headed. Long whiskers catfish is mainly used in Myanmar. Sometimes, whole fish can be seen for fish paste prepared with big species. The processes can be varied based on species, which may include cleaning, kneading, or pounding. Then fish are mixed with salt for fermenting and by-products decanting liquid may be used as fish sauce (Ngan-pyar-yay).
Sometimes, in low-income families, Nga-pi-yay, a watery preparation, forms the main dish and also the main source of protein. It is one of the main ingredients for lower Myanmar cuisines. However, it is not very popular in upper Myanmar, for example, Shan State.
Fermented fish (Nga-chin) and fermented shrimp (Pa-zun-chin)
Pickled fish (Nga-chin) and pickle shrimp (Pa-zun-chin) are made by fermenting small fish or shrimps, mixed with rice and salt. Unlike fish or shrimp paste, it has a sour taste due to the fermentation with lactic acid bacteria. It is mainly consumed as a side dish, typically prepared raw or fried with onion and oil.
Results
Location and ethnicity of the respondent
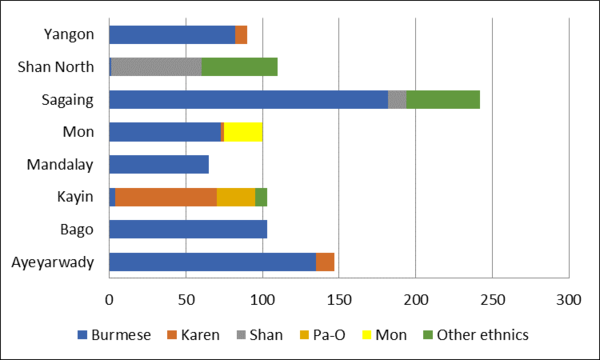
This study comprised 960 households from eight different states and regions, in particular, 45.8% of the respondents were from the Delta and Coastal Region, 32% were from the Dry Zone, and 22.2% of the respondents were from the Hilly Region (Figure 22).
Two-third of the respondents were Burmese followed by Karen (9%), Shan (7%), and 3% Mon and Pao. Other ethnicities accounted for 11% of the total respondents.
Consumption of fresh fish and processed fish
Consumption of any fish in a week
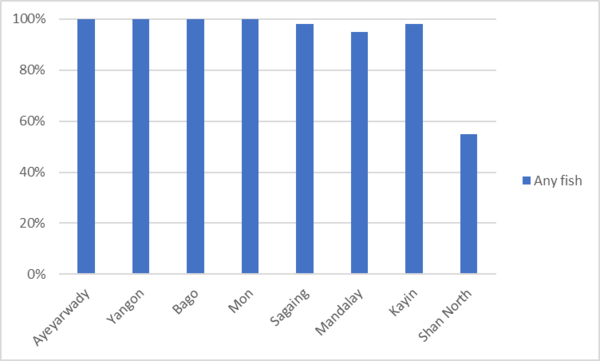
Figure 24 shows the high rate of fish consumption of households from all the focused areas. Almost every households in the Delta and Coastal Region (Ayeyarwady, Yangon, Bago and Mon) consumed at least one type of fish within the last week of the survey. 95% to 98% of the households in the Dry Zone (Mandalay and Sagaing) and Kayin from the Hilly Region also consumed fish within a week. Shan North has the lowest level of fish consumption; however, 55% of the households consumed at least one type of fish products in the last week.
Both fresh and processed fish are consumed frequently in the surveyed areas except Shan North. The households in Ayeyarwaddy, Yangon, Bago, Mon and Kayin consumed any fish more than Sagaing, Mandalay and Shan North. Figure 14 shows that processed fish consumptions were significantly higher in Sagaing, Mandalay, and Kayin, which are located in the Dry Zone and the Hilly Region. Mon State was the only area that had higher fresh fish consumption with 99%. Among the surveyed areas, Shan North had the lowest consumption of any type of fish.
Consumption of any processed fish in a week by location
Table 1 shows fermented fish products were the most consumed processed fish in Ayeyarwady, Yangon, Ayeyarwady, Mon, Kayin and Sagaing with 95%, 91%, 90%, 89%, 87%, 84% respectively. Besides, the households in Shan North reported that only 6% of them consumed fermented fish. Dried fish was the second highest consumed processed fish, comprising more than 70% of the consumption in most states and regions, except for Ayeyarwady (57%), Sagaing (40%), and Shan North (18%). Dried shrimp consumption was thirdly most consumed especially in Ayeyarwaddy, Kayin, and Yangon. There was no consumption of dried shrimp in Shan North. It was followed by the consumption of salted fish which was around 20% in Ayayarwady, Mon, Sagain, and Shan North, while Yangon, Bago, Mandalay, and Kayin had the lowest salted fish consumption with 9%, 3%, 6%, and 8 % respectively. The consumptions of smoked fish, canned fish and other types were not significant.
|
Delta & Coastal region |
Central Dry Zone |
Hilly Region | ||||||
|---|---|---|---|---|---|---|---|---|
| Processed fish products | Ayeyarwady | Yangon | Bago | Mon | Sagaing | Mandalay | Kayin | Shan North |
| Any fermented products | 90% | 91% | 95% | 89% | 84% | 66% | 87% | 6% |
| Any dried fish | 57% | 73% | 73% | 77% | 40% | 74% | 77% | 18% |
| Any dried shrimp | 42% | 53% | 30% | 35% | 20% | 19% | 43% | 0% |
| Any salted fish | 22% | 9% | 3% | 19% | 20% | 6% | 8% | 20% |
| Any smoked fish | 2% | 4% | 1% | 6% | 0% | 3% | 12% | 1% |
| Canned fish | 1% | 3% | 3% | 6% | 21% | 2% | 19% | 7% |
| Any other fish products | 1% | 8% | 9% | 24% | 10% | 14% | 21% | 15% |
Consumption of fresh fish in a week by location
As shown in Table 2 that between 70% and 80% of the households in Ayeyarwady, Bago, Kayin, Sagaing and Yangon consumed freshwater fish within a week, followed by over 50 % in Mandalay Region and Mon State. 66% of the responded households from Shan North mentioned that they did not eat any fresh fish in the last week.
Marine fish was noticeably consumed in Mon State with 61% of the households’ consumption, followed by Ayeyarwady (25%), Bago (36%), and Yangon (34%), and lowest in Kayin and Mandalay with 8% each. There was no marine fish consumption in Sagaing and Shan North.
Fresh shrimp consumption was lower with 33% in Yangon and 31% in Ayeyarwady, followed by Kayin with 15%, whereas the remaining areas hardly consumed fresh shrimp. Additionally, squid, molluscs and other had nearly 0% of consumption across the surveyed areas, and the respondents were not preferred to eat fish coming from unknown origin.
|
Delta & Coastal region |
Central Dry Zone |
Hilly Region | ||||||
|---|---|---|---|---|---|---|---|---|
| Fresh fish | Ayeyarwady | Yangon | Bago | Mon | Sagaing | Mandalay | Kayin | Shan North |
| Any fresh fish | 99% | 96% | 97% | 99% | 79% | 72% | 85% | 35% |
| No fresh fish | 1% | 4% | 3% | 2% | 21% | 28% | 15% | 66% |
| Fresh fish (freshwater) | 75% | 77% | 70% | 51% | 79% | 57% | 82% | 35% |
| Fresh fish (marine) | 25% | 34% | 36% | 61% | 0% | 8% | 8% | 0% |
| Fresh fish (origin unknown) | 2% | 1% | 2% | 0% | 0% | 6% | 0% | 0% |
| Fresh shrimp | 31% | 33% | 2% | 4% | 3% | 8% | 15% | 2% |
| Fresh squid, molluscs, other | 0% | 2% | 0% | 0% | 0% | 0% | 0% | 0% |
Consumption of fermented fish in a week by location
Overall, between 90% and 95% of the households in the Delta and Coastal Region (Ayeyarwady, Bago, and Yangon), and over 80% of the responded households from Kayin, Mon and Sagaing consumed at least one kind of fermented fish in the last week. Fermented fish consumption was moderate in Mandalay with 66% and lowest in Shan North with 6%.
As shown in Table 3, Nga-pi-yay (freshwater), Nga-pi-yay (marine), shrimp paste (medium quality), shrimp paste-other, fish paste (whole fish, mixed species) were the most prominent products among eleven categories. Among them, Nga-pi-yay processed with freshwater fish was the most consumed type, followed by Nga-pi-yay prepared with marine fish. It is noted that 70% of the households in Bago consume Nga-pi-yay (freshwater), 59% in Yangon, 52% in Kayin and Mon, and 48% in Ayeyarwady, while Mandalay and Sagaing has a very low consumption (Table 3). There was no consumption of Nga-pi-yay in Shan North. Nga-pi-yay (marine) accounts for 22% in Mon State, 18% in Ayeyarwady, 16% in Bago, 8% in Yangon, and no consumption was found in Kayin, Mandalay, Sagaing and Shan North.
Medium quality shrimp paste was the most consumed type of shrimp paste. Bago and Shan North have a low rate of consumption and no consumption was found in Yangon and Mon State. ‘Other type’ of shrimp paste is the second most consumed type, with 34% in Sagaing, 22% in Mandalay, and less than 5% in the other states and regions.
In the fish paste category, whole fish - mixed species is the most consumed type with 25% in Kayin, 16% in Yangon, no consumption in Shan North, and the percentage of consumption in the other states and region was very low.
|
Delta & Coastal region |
Central Dry Zone |
Hilly Region | ||||||
|---|---|---|---|---|---|---|---|---|
| Fermented products | Ayeyarwady | Yangon | Bago | Mon | Sagaing | Mandalay | Kayin | Shan North |
| Any fermented products | 90% | 91% | 95% | 89% | 84% | 66% | 87% | 6% |
| No fermented products | 10% | 9% | 5% | 11% | 16% | 34% | 13% | 95% |
| Shrimp paste (best quality) | 3% | 1% | 0% | 0% | 0% | 9% | 9% | 0% |
| Shrimp paste (medium quality) | 16% | 0% | 3% | 0% | 33% | 20% | 14% | 1% |
| Shrimp paste (low quality) | 0% | 0% | 2% | 1% | 11% | 0% | 0% | 3% |
| Shrimp paste - Other | 1% | 0% | 5% | 0% | 34% | 22% | 0% | 2% |
| Fish paste (whole fish, single species) | 3% | 2% | 2% | 0% | 1% | 0% | 3% | 0% |
| Fish paste (whole fish, mixed species) | 3% | 16% | 3% | 1% | 5% | 3% | 25% | 0% |
| Fish paste (broken fish, mixed species) | 2% | 3% | 0% | 1% | 0% | 0% | 2% | 0% |
| Fish paste - Other | 0% | 9% | 6% | 16% | 0% | 5% | 0% | 0% |
| Nga-pi-yay (freshwater) | 48% | 59% | 70% | 52% | 2% | 9% | 52% | 0% |
| Nga-pi-yay (marine) | 18% | 8% | 16% | 22% | 0% | 0% | 0% | 0% |
| Nga-pi-yay (origin unknown) | 1% | 0% | 0% | 2% | 0% | 0% | 2% | 0% |
Table 4 indicates that fermented fish were reported 152 times, when the all the respondents were asked to specify what species of fermented fish they consumed in the last week.
| English name | Myanmar name | Scientific name | Habitat | Number of responses |
|---|---|---|---|---|
| Unknown species | 78 | |||
| Shrimp | 38 | |||
| Long whiskers catfish | Nga-zin-yine | Mystus gulio | Freshwater; brackish; | 17 |
| Mixture of small fish | 11 | |||
| Manipur osteobrama | Nga-phel-oun | Osteobrama belangeri | Freshwater; | 2 |
| Swamp barb | Nga-khone-ma | Puntius chola | Freshwater | 1 |
| Stone roller | Nga-lu | Crossochilus latia | Freshwater; brackish | 1 |
| Climbing Perch | Nga-bye-ma | Anabas testudineus | Freshwater; brackish | 1 |
| Barramundi | Ka-ka-dit | Lates calcarifer | Marine; freshwater; brackish | 1 |
| Large head hairtail | Nga-tan-khon | Trichiurus lepturus | Marine; brackish | 1 |
| Striped snakehead | Nga-yan | Channa striata | Freshwater; brackish; | 1 |
Consumption of dried fish in a week by location
In general, the consumption of any type of dried fish was high in Mon (77%), Bago (73%), Kayin (77%), Mandalay (74%) and Yangon (73%), moderate in Ayeyarwady (57%) and Sagaing (40%), and low in Shan North (18%) (Table 5).
It was observed that dried medium-sized marine fish, dried Bombay duck, and dried snake head, which are marine and freshwater species, were consumed most. Dried medium-sized marine fish accounts for 33% in Yangon, between 10% and 30% in Bago, Kayin, Mon and Sagaing, while the remaining areas consumed less than 5% per household. Dried Bombay duck was consumed in 30% of the households in Mon State, 27% in Yangon, over 10% respectively in Kayin, Mandalay, Shan North. 23% of the households in Mandalay consumed dried snakehead catfish within the last week of the surveyed period, followed by between 10% and 20% in Bago, Ayeyarwady, Mon, Kayin and Yangon. It had the lowest consumption in Sagaing and Shan North with the same percentage (3%).
|
Delta & Coastal region |
Central Dry Zone |
Hilly Region | ||||||
|---|---|---|---|---|---|---|---|---|
| Dried fish products | Ayeyarwady | Yangon | Bago | Mon | Sagaing | Mandalay | Kayin | Shan North |
| Any dried fish | 57% | 73% | 73% | 77% | 40% | 74% | 77% | 18% |
| No dried fish | 44% | 27% | 27% | 23% | 60% | 26% | 23% | 82% |
| Dried snakehead | 14% | 14% | 19% | 12% | 3% | 23% | 9% | 3% |
| Dried Bombay duck | 5% | 27% | 7% | 30% | 2% | 17% | 12% | 10% |
| Dried anchovy (small) | 13% | 1% | 4% | 1% | 3% | 11% | 1% | 4% |
| Dried anchovy (butterflied) | 0% | 0% | 0% | 0% | 0% | 6% | 0% | 0% |
| Dried small freshwater fish | 14% | 0% | 2% | 5% | 6% | 3% | 16% | 0% |
| Dried medium freshwater fish | 1% | 7% | 1% | 0% | 12% | 8% | 3% | 0% |
| Dried large freshwater fish | 0% | 0% | 0% | 0% | 0% | 0% | 3% | 0% |
| Dried small marine fish | 8% | 11% | 12% | 13% | 5% | 6% | 8% | 1% |
| Dried medium marine fish | 4% | 33% | 29% | 26% | 9% | 2% | 13% | 1% |
| Dried large marine fish | 0% | 7% | 5% | 2% | 0% | 2% | 11% | 0% |
| Dried fish, origin unknown | 1% | 0% | 3% | 0% | 1% | 12% | 12% | 0% |
Table 6 shows the fish species that are consumed as dried fish according to the total of 363 responses. 45 species of dried fish were reported, of which most inhabitants both freshwater and brackish. Among them giant catfish, chub mackerel, Pama croaker, Burmese River ilisha, Indo-Pacific king mackerel, long whiskers catfish, Bombay duck, and flathead grey mullet were the common type of dried fish.
| English name | Myanmar name | Scientific name | Habitat | Number of responses |
|---|---|---|---|---|
| Unknown species | 66 | |||
| Giant catfish | Nga-yaung | Arius thalassinus | Marine, freshwater, brackish | 35 |
| Chub mackerel | Nga-mae-lone | Scomber japonicus | Marine; | 34 |
| Pama croaker | Nga-poke-thin | Otolithoides pama | Marine, freshwater; brackish | 32 |
| Burmese River ilisha | Nga-zin-pyar | Ilisha novacula | Freshwater | 20 |
| Indo-Pacific king mackerel | Nga-kwin-shat | Scomberomorus guttatus | Marine; brackish; | 16 |
| Long whiskers catfish | Nga-zin-yine | Mystus gulio | Freshwater; brackish; | 15 |
| Bombay Duck | Nga-hnat | Harpadon nehereus | Marine; brackish | 14 |
| Flathead grey mullet | Ka-bhi-lu | Mugil cephalus | Marine; freshwater; brackish | 13 |
| Variety Of Small Fish | 11 | |||
| Largehead hairtail | Nga-tan-khon | Trichiurus lepturus | Marine; brackish | 9 |
| Blackspot shark | Nga-man | Carcharhinus sealei | Marine; | 9 |
| Brushtooth Lizardfish | Nga-pa-lway | Saurida undosquamis | Marine | 6 |
| Peacock eel | Nga-mway-htoe | Macrognathus siamensis | Freshwater | 6 |
| Yellow Pike Conger | Nga-shwe | Congresox talabon | Marine; brackish; | 5 |
| Snakeskin gourami | Belar | Trichogaster pectoralis | Freshwater | 4 |
| Swamp barb | Nga-khone-ma | Puntius chola | Freshwater | 4 |
| Butter catfish | Nga-nu-than | Ompok bimaculatus | Freshwater; brackish | 4 |
| Dwarf Catfish | Nga-than-chaik | Pseudotropius acutirostris | Freshwater | 4 |
| Indian mackerel | Pa-la-tu | Rastrelliger kanagurta | Marine | 4 |
| Ocellated pufferfish | Nga-pu-tin | Tetraodon cutcutia | Freshwater; brackish; | 4 |
| Climbing Perch | Nga-bye-ma | Anabas testudineus | Freshwater; brackish | 3 |
| Long tongue sole | Nga-khwae-shar | Cynoglossus lingua | Marine; freshwater; brackish | 3 |
| Sailfin flyingfish | Nga-pyan | Parexocoetus brachypterus | Marine; | 3 |
| Hilsa Shad | Nga-tha-lauk | Tenualosa ilisha | Marine; freshwater; brackish | 3 |
| Striped snakehead | Nga-yan | Channa striata | Freshwater; brackish; | 3 |
| Pangas catfish | Nga-tan | Pangasius pangasius | Freshwater; brackish; | 3 |
| Blue tilapia | Ti-lar-bee-yar | Oreochromis aureus | Freshwater; brackish | 3 |
| Whiptail Stingrays | Nga-lake-kyouk | Dasyatidae | Marine | 3 |
| Anchovy | Nga-ni-tu | Stolephorus indicus | Marine; brackish | 2 |
| Eel-tailed catfish | Nga-eike | Tandanus tandanus | Freshwater; | 2 |
| Barramundi | Ka-ka-dit | Lates calcarifer | Marine; freshwater; brackish | 2 |
| Burmese loach | Nga-tha-le-htoe | Lepidocephalus berdmorei | Freshwater | 2 |
| Longfin Mogarra | Nga-bae-phyu | Pentaprion longimanus | Marine; brackish | 2 |
| Atlantic herring | Clupea harengus | Marine; brackish | 2 | |
| Bearded eel goby | Nga-de | Taenioides cirratus | Marine; freshwater; brackish | 1 |
| Catfish | Nga-khoo | Clarias batrachus | Freshwater; brackish | 1 |
| Goldspotted grenadier anchovy | Mee-tan-thwae | Coilia dussumieri | Marine; freshwater; brackish | 1 |
| Cuchia | Nga-shint | Monopterus cuchia | Freshwater; brackish | 1 |
| False Travally | Nga-tee | Lactarius lactarius | Marine; brackish | 1 |
| Wallago | Nga-bat | Wallago attu | Freshwater; brackish | 1 |
| Gangetic leaffish | Nga-wetma | Nandus nandus | Freshwater; brackish | 1 |
| Paradise threadfin | Nga-pone-nar | Polynemus paradiseus | Marine; freshwater; brackish | 1 |
| Silver pomfret | Nga-moke-phyu | Pampus argenteus | Marine; | 1 |
| Salmon Catfish | Neoarius leptaspis | Marine; freshwater; brackish; | 1 | |
| Stripped Goatfish | Kyoe-war | Upeneus vittatus | Marine; brackish | 1 |
| Indian threadfin | Ka-ku-yan | Polynemus indicus | Marine; brackish; | 1 |
Consumption of dried shrimp in a week by location
Dried shrimp consumption was high in Yangon (53%), Kayin (43%) and Ayeyarwady (42%), moderate in Bago (30%) and Mon (35%), and low in Mandalay (19%) and Sagaing (20%) (Table 7). There was no consumption of dried shrimp in Shan North.
Among various sizes of dried shrimp, the big size and jumbo size were rarely consumed in all the surveyed areas.
|
Delta & Coastal region |
Central Dry Zone |
Hilly Region | ||||||
|---|---|---|---|---|---|---|---|---|
| Dried shrimp products | Ayeyarwady | Yangon | Bago | Mon | Sagaing | Mandalay | Kayin | Shan North |
| Any dried shrimp | 42% | 53% | 30% | 35% | 20% | 19% | 43% | 0% |
| No dried shrimp | 58% | 47% | 70% | 65% | 80% | 82% | 57% | 100% |
| Dried shrimp (jumbo) | 0% | 0% | 0% | 0% | 0% | 3% | 0% | 0% |
| Dried shrimp (big) | 1% | 1% | 0% | 2% | 1% | 2% | 1% | 0% |
| Dried shrimp (medium) | 8% | 11% | 10% | 11% | 5% | 3% | 10% | 0% |
| Dried shrimp (very small) | 27% | 34% | 13% | 23% | 11% | 11% | 28% | 0% |
| Dried shrimp powder | 8% | 8% | 10% | 5% | 3% | 5% | 4% | 0% |
Consumption of salted fish in a week by location
Table 8 shows that salted fish (Nga Sa Nel) is consumed in around 10% to 20% of the households in Ayeyarwady, Mon, Sagaing, and Shan North. The other areas consumed less than 10%. Among various types of salted fish, medium-sized freshwater is the most preferable size salted fish, followed by that of small-sized and large-sized marine fish. Salted large freshwater species are rarely consumed.
|
Delta & Coastal region |
Central Dry Zone |
Hilly Region | ||||||
|---|---|---|---|---|---|---|---|---|
| Salted fish products | Ayeyarwady | Yangon | Bago | Mon | Sagaing | Mandalay | Kayin | Shan North |
| Any salted fish | 22% | 9% | 3% | 19% | 20% | 6% | 8% | 20% |
| No salted fish | 78% | 91% | 97% | 81% | 80% | 94% | 92% | 80% |
| Salted small freshwater fish | 5% | 1% | 0% | 2% | 4% | 5% | 2% | 16% |
| Salted medium freshwater fish | 10% | 7% | 2% | 4% | 16% | 0% | 6% | 5% |
| Salted large freshwater fish | 0% | 1% | 0% | 0% | 0% | 2% | 0% | 0% |
| Salted large marine fish | 7% | 1% | 1% | 13% | 0% | 0% | 0% | 0% |
According to 145 total responses and shown in Table 9, 23 species were reportedly used to be salted, of which 16 species inhabit both freshwater and brackish. Stone roller, Manipur Osteobrama, Catfish, and Striped Snakehead are the most common species, reported by 13, 12, 11 and 10 respondents respectively.
| English name | Myanmar name | Scientific name | Habitat | Number of responses |
|---|---|---|---|---|
| Unknown species | 46 | |||
| Stone roller | Nga-lu | Crossochilus latia | Freshwater; brackish | 13 |
| Manipur osteobrama | Nga-phel-oun | Osteobrama belangeri | Freshwater; | 12 |
| Catfish | Clarias batrachus | Freshwater; brackish | 11 | |
| Striped snakehead | Nga-yan | Channa striata | Freshwater; brackish; | 10 |
| Giant catfish | Nga-yaung | Arius thalassinus | Marine; freshwater; brackish | 8 |
| Squaretail mullet | Ka-be-lu | Ellochelon vaigiensis | Marine; freshwater; brackish | 7 |
| Swamp barb | Nga-khone-ma | Puntius chola | Freshwater | 6 |
| Clown knifefish | Nga-pe | Chitala chitala | Freshwater | 3 |
| Spotted snakehead | Nga yan-panaw | Ophiocephalus punctatus | Freshwater; brackish; | 3 |
| Wallago | Nga-bat | Wallago attu | Freshwater; brackish | 3 |
| Mrigal Carp | Nga-gyin | Cirrhinus cirrhosus | Freshwater; brackish | 3 |
| Indian glassy fish | Nga-zin-sat | Parambassis ranga | Freshwater; brackish | 3 |
| Pama croaker | Nga-poke-thin | Otolithoides pama | Marine; freshwater; brackish; | 3 |
| Long whiskers catfish | Nga-zin-yine | Mystus gulio | Freshwater; brackish; | 3 |
| Blue tilapia | Ti-lar-bee-yar | Oreochromis aureus | Freshwater; brackish | 3 |
| Brushtooth Lizardfish | Nga-pa-lway | Saurida undosquamis | Marine | 2 |
| Manipur osteobrama | Nga-phel-oun | Osteobrama belangeri | Freshwater; | 1 |
| Climbing Perch | Nga-bye-ma | Anabas testudineus | Freshwater; brackish | 1 |
| Eel-tailed catfish | Nga-eike | Tandanus tandanus | Freshwater; | 1 |
| Hilsa Shad | Nga-tha-lauk | Tenualosa ilisha | Marine; freshwater; brackish | 1 |
| Indo-Pacific king mackerel | Nga-kwin-shat | Scomberomorus guttatus | Marine; brackish; | 1 |
| Barramundi | Ka-ka-dit | Lates calcarifer | Marine; freshwater; brackish | 1 |
Consumption of smoked fish in a week by location
The consumption of smoked fish was very low in all surveyed areas as shown Table 10. Kayin State had the significant percentage of smoked fish consumption (12%) while the other areas remained between 1 % and 6%. There was no consumption is found in Sagaing Region.
|
Delta & Coastal region |
Central Dry Zone |
Hilly Region | ||||||
|---|---|---|---|---|---|---|---|---|
| Smoked fish products | Ayeyarwady | Yangon | Bago | Mon | Sagaing | Mandalay | Kayin | Shan North |
| Any smoked fish | 2% | 4% | 1% | 6% | 0% | 3% | 12% | 1% |
| No smoked fish | 98% | 96% | 99% | 94% | 100% | 97% | 88% | 99% |
| Smoked small freshwater fish | 1% | 3% | 0% | 1% | 0% | 2% | 4% | 1% |
| Smoked medium freshwater fish | 1% | 1% | 0% | 3% | 0% | 2% | 8% | 0% |
| Smoked large freshwater fish | 0% | 0% | 0% | 0% | 0% | 0% | 0% | 0% |
| Other smoked fish | 0% | 0% | 1% | 2% | 0% | 0% | 0% | 0% |
Total 14 fish species were reportedly used to be smoked. Most of them inhabit either freshwater or brackish (Table 11). Striped snakehead, blue tilapia, and swamp barb are mostly used to be smoked.
| English name | Myanmar name | Scientific name | Habitat | Number of responses |
|---|---|---|---|---|
| Unknown species | 3 | |||
| Striped snakehead | Nga-yan | Channa striata | Freshwater; brackish; | 3 |
| Blue tilapia | Ti-lar-bee-yar | Oreochromis aureus | Freshwater; brackish | 3 |
| Swamp barb | Nga-khone-ma | Puntius chola | Freshwater | 3 |
| Catfish | Nga-khoo | Clarias batrachus | Freshwater; brackish | 2 |
| Climbing Perch | Nga-bye-ma | Anabas testudineus | Freshwater; brackish | 2 |
| Eel-tailed catfish | Nga-eike | Tandanus tandanus | Freshwater; | 2 |
| Hilsa Shad | Nga-tha-lauk | Tenualosa ilisha | Marine; freshwater; brackish | 2 |
| Peacock eel | Nga-mway-htoe | Macrognathus siamensis | Freshwater | 2 |
| Stinging catfish | Nga-gyi | Heteropneustes fossilis | Freshwater; brackish | 2 |
| Pabdah catfish | Nga-nu-than | Ompok pabda | Freshwater | 1 |
| Gangetic leaffish | Nga-wetma | Nandus nandus | Freshwater; brackish | 1 |
| Brushtooth Lizardfish | Nga-pa-lway | Saurida undosquamis | Marine | 1 |
| Clown knifefish | Nga-pe | Chitala chitala | Freshwater | 1 |
| Barramundi | Ka-ka-dit | Lates calcarifer | Marine; freshwater; brackish | 1 |
Consumption of other fish products in a week by location
Four main products were identified in the other fish products category. In Mon State, 24% of the households consumed some type of fish products, followed by 21% in Kayin and between 10% and 15% in Sagaing, Mandalay and Shan North. The consumption was lower than 10% in the remaining three states and regions. Among the four types, other fermented fish product was the most reported type, followed by Balachaung. According to Table 12, pickled fish is consumed in 19% of the households in Mon, 9% in Sagaing, and 8% in Shan North.
|
Delta & Coastal region |
Central Dry Zone |
Hilly Region | ||||||
|---|---|---|---|---|---|---|---|---|
| Other fish products | Ayeyarwady | Yangon | Bago | Mon | Sagaing | Mandalay | Kayin | Shan North |
| Any other fish products | 1% | 8% | 9% | 24% | 10% | 14% | 21% | 15% |
| No other fish products | 99% | 92% | 91% | 76% | 91% | 86% | 79% | 86% |
| Balachaung (shrimp) | 0% | 1% | 7% | 0% | 0% | 9% | 6% | 5% |
| Balachaung (fish) | 0% | 1% | 0% | 4% | 1% | 6% | 14% | 4% |
| Other fermented shrimp product | 1% | 3% | 1% | 1% | 0% | 0% | 1% | 3% |
| Other fermented fish product | 1% | 2% | 1% | 19% | 9% | 0% | 2% | 8% |
Per capita consumption of fresh and processed fish
The overall fish consumption was high in the Delta and Costal Area (Ayeyarwady, Bago and Yangon) and the Hilly Region (Mon and Kayin), accounting for around 100g/capita per day, moderate in the Dry Zone (Mandalay and Sagaing), with around 70g/capita, and low in the Hilly Region (Shan North) with 14g/capita. Generally, the per capita consumption of fresh fish was higher than the consumption of processed fish, except in Mandalay and Shan North. Per capita consumption of fresh fish ranges between 70g to 80g per day in the Delta and Coastal Region, between 50g and 60g in Southeast regions, between 20 and 50g in the Dry Zone, and 6g in the Hilly Region.
The per capita consumption of processed fish ranges between 40g and 50g per day, except Sagaing with 25g and Shan North with 9g. In the category of processed fish, fermented products were consumed most, followed by dried fish. The per capita consumption of salted fish and dried shrimp was medium and the consumption of smoked fish and other fish products was low.
The per capita consumption of fermented fish products was high in the Delta and Coastal Region and the Hilly Region, ranges between 10g and 15g. In the Dry Zone Area, the per capita consumption ranged between 10g and 15 g and per capita consumption was low in Hilly Region with only 0.2g.
Per capita consumption of dried fish was significantly higher in Mandalay and Mon, with around 20g per day. The consumption ranges between 10g and 17g in the Delta and Coastal Region, while Sagaing and Shan North had the lowest per capita consumption of dried fish. Overall, per capita consumption of salted fish ranges between 1g to 5g, and it was slightly higher in Ayeyarwady, Sagaing and Mon.
The daily average consumption of dried shrimp ranged between 1g and 4g per capita, with the highest amount in the Delta and Coastal Regions, whereas no dried shrimp was consumed in Shan North. The consumption of smoked fish was limited to a maximum of 1g per capita, consumed mainly in Kayin and Mon. For any other fish products, per capita consumption was below 2g, being lowest in Yangon and Ayeyarwady.
Figure 26 summarizes all the different categories of fish described in this study. For a better understanding of the figure, it should be noted that ‘any fish’ means any kind of fish, including fresh, dried, fermented, and ‘any processed fish’ includes everything except fresh and canned fish.
Fermented products were consumed most in a week before the survey, followed by fresh fish and dried fish, with dried shrimp being consumed least. Salted fish was consumed only one time and was only consumed in Ayeyarwady and Sagaing, whereas hardly any household consumed smoked fish.
In the category of processed fish, fermented products were consumed only seven times and consumption was generally higher in the Delta and Coastal Region, compared to the central Dry Zone and the Hilly Region, where no fermented products were consumed at all. Fresh fish was consumed on average 1 to 5 times in the seven days. Similar to previous results, the consumption was higher in Delta and Coastal Region compared to the Dry Zone and Hilly Region. The frequency of dried fish consumption ranged between 1 and 3 times a week, whereas dried shrimp was only consumed twice, and not at all in the Hilly Region. The frequency of any salted fish consumption was the lowest and was only observed in Ayeyarwady and Sagaing. It is worth noting that in no state and region smoked fish was consumed in the past seven days before the survey.
Per capita consumption of fresh fish by location
Regarding the daily per capita consumption of fresh fish, freshwater fish consumption was seen in all the targeted states and regions, while marine fish consumption was mainly found in the Delta and Coastal Region. The percentage for fresh shrimp and fresh fish of unknown origin was the lowest, and their consumption was only observed in some states and regions. It is worth noting that most people know the origin of their fish, indicating that people are aware of it.
The daily consumption of freshwater fish varied between 50g and 60g per capita in Ayeyarwady, Bago, Kayin, Sagaing, and Yangon as it can be seen in Figure 28. Moderate consumption with 26g per capita was observed in Mon State, and was lowest in Mandalay (17g) and Shan North (6g). Marine fish consumption was highest in Mon State (37g), which is located near the coast. The consumption was moderately high in Ayeyarwady, Bago and Yangon with 10g to 20g, and lowest in Kayin (3g) and Mandalay (2g). Fresh shrimp consumption varied from 1g to 8g per capita, whereas fresh fish of unknown origin accounted for 2g to 3g per capita.
Per capita consumption of fermented fish products by location
Per capita consumption of different Nga-pi-yay was highest, followed by shrimp paste. Fish paste has the lowest per capita consumption (Table 13). The per capita consumption of Nga-pi-yay fluctuated between 0.1g and 14g, between 0.1g and 6g for shrimp paste and between 0.09g and 5g for fish paste.
|
Delta & Coastal region |
Central Dry Zone |
Hilly Region | ||||||
|---|---|---|---|---|---|---|---|---|
| Fermented products | Ayeyarwady | Bago | Yangon | Mon | Mandalay | Sagaing | Kayin | Shan North |
| Shrimp paste (best quality) | 0.25% | 0% | 0.20% | 0% | 2% | 0.02% | 1% | 0% |
| Shrimp paste (medium quality) | 2% | 0.19% | 0% | 0% | 3% | 6% | 1% | 0.04% |
| Shrimp paste (low quality) | 0% | 1% | 0% | 0.10% | 0% | 1% | 0% | 0.10% |
| Shrimp paste - Other | 0.17% | 1% | 0% | 0.% | 2% | 3% | 0% | 0.07% |
| Fish paste (whole fish, single species) | 1% | 1% | 0.45% | 0% | 0% | 0.15% | 3% | 0% |
| Fish paste (whole fish, mixed species) | 0.36% | 1% | 2% | 0.08% | 0.44% | 0.47% | 5% | 0% |
| Fish paste (broken fish, mixed species) | 0.46% | 0% | 1% | 0.33% | 0% | 0.03% | 0.09% | 0% |
| Fish paste - Other | 0% | 1% | 2% | 2% | 1% | 0% | 0% | 0% |
| Nga-pi-yay (freshwater) | 9% | 14% | 12% | 7% | 1% | 0.10% | 7% | 0% |
| Nga-pi-yay (marine) | 4% | 3% | 2% | 5% | 0% | 0% | 0% | 0% |
| Nga-pi-yay (origin unknown) | 0.01% | 0% | 0% | 0.37% | 0% | 0% | 0% | 0% |
Figure 29, extracted from table 13, shows the daily per capita consumption of four fermented product groups. The per capita consumption of Nga-pi-yay (freshwater) in the Delta Region (Ayeyarwady, Yangon, Bago) was twice of the consumption in the south-east (Mon State and Kayin). Nga-pi-yay (marine) was mainly consumed in the Delta region and Mon State, while it was low in the Dry Zone, with no consumption in Kayin, Mandalay and Sagaing. No Nga-pi-yay consumption was found in Northern Shan, which is in the Hilly Region. Per capita consumption of Shrimp paste was high in the Dry Zone, moderate in Ayeyarwady, and low in Kayin and Bago, whereas per capita consumption of fish paste is high in Kayin, moderate in Yangon and Bago, and low in Mandalay.
The daily consumption of Nga-pi-yay (freshwater) varied between 10g and 14g per capita, whereas Nga-pi-yay (marine) daily consumption ranged between 1g and 5g per capita (Figure 30). Shrimp paste daily consumption accounts for 1g to 6g per capita, while fish paste accounts for 1g to 5g/capita.
Per capita consumption of dried fish by location
Dried Bombay Duck was the most consumed dried fish species and can be found in most states and regions. The per capita consumption of dried Bombay Duck was significantly higher in Mon with 8g, where produce high quantity of dried Bombay Duck (Figure 31). There are 4g in Mandalay, Shan North, and Yangon, and 1g, which was the lowest in Ayeyarwady, Bago and Kayin.
Dried medium-sized marine fish was the second most consumed type and its per capita consumption ranged between 0.18g and 7g, followed by dried snakehead with a per capita consumption ranged between 1g and 4g (Table 14).
|
Delta & Coastal region |
Central Dry Zone |
Hilly Region | ||||||
|---|---|---|---|---|---|---|---|---|
| Ayeyarwady | Yangon | Bago | Mon | Sagaing | Mandalay | Kayin | Shan North | |
| Dried small freshwater fish | 4% | 0% | 1% | 1% | 1% | 0.4% | 3% | 0% |
| Dried snakehead | 2% | 1% | 4% | 4% | 0% | 3% | 2% | 0% |
| Dried anchovy (small) | 2% | 0.2% | 1% | 0.15% | 0% | 3% | 0% | 0.3% |
| Dried Bombay duck | 1% | 4% | 1% | 8% | 0% | 4% | 1% | 4% |
| Dried small marine fish | 1% | 3% | 3% | 3% | 0% | 1% | 1% | 0.05% |
| Dried medium marine fish | 1% | 6% | 7% | 5% | 1% | 0.18% | 2% | 0% |
| Dried fish, origin unknown | 0.15% | 0% | 1% | 0% | 0% | 8% | 2% | 0% |
| Dried medium freshwater fish | 0% | 1% | 0.22% | 0% | 2% | 1% | 0.45% | 0% |
| Dried anchovy (butterflied) | 0% | 0% | 0% | 0% | 0.04% | 1% | 0% | 0% |
| Dried large freshwater fish | 0% | 0% | 0% | 0% | 0% | 0% | 1% | 0% |
| Dried large marine fish | 0% | 2% | 0% | 0.43% | 0% | 0.15% | 2% | 0% |
Per capita consumption of dried shrimp by location
Overall, per capita consumption of dried shrimp was high in Ayeyarwady, moderate in Bago, Kayin, Mon State and Yangon, and low in Mandalay and Sagaing, with no dried shrimp consumption in Shan North (Figure 32). Dried shrimp (very small) was the most consumed size and per capita consumption ranged between 1g and 2g, followed by dried shrimp (medium) with 1g. The per capita consumption of dried shrimp powder ranged between 0.1g and 1g, while dried shrimp (big) remained at 0.12 g, and dried shrimp (jumbo) at 0.26g.
Per capita consumption of salted fish by location
Per capita consumption of salted fish was highest in Ayeyarwady followed by Sagaing and Mon, whereas it is generally low in Yangon, Bago, Mandaly, Kayin and Shan North (Figure 33). Salted small freshwater fish were consumed most with per capita consumption between 1g and 3g, followed by salted large freshwater fish with per capita consumption between 0.3g and 1g. Salted medium freshwater had the third highest per capita consumption between 0.4g and 2g, whereas salted large marine fish was the lowest.
Per capita consumption of smoked fish by location
Figure 34 shows that per capita consumption of smoked fish was highest in Kayin, followed by Yangon, and low in Ayeyarwady, Bago, Mandalay, Mon and Shan North. There was no smoked fish consumption in Sagaing. Variety of smoke fish was mentioned to be mostly consumed from 0.1g to 1g. It was followed by smoked large freshwater fish with a per capita consumption ranging between 0.03g and 1g.
Source of fish consumed
Source of fresh fish consumed
60% to 80% of the households purchased some kind of fresh fish, with own-production being slightly higher in Mon State with 32% and 54% in Ayeyarwady compared to 3% in Mandalay and 8% in Sagaging (Table 15). In other areas, the own-production rate ranged between 18% and 20%. Very few respondents received fresh fish as a gift (1% to 5%).
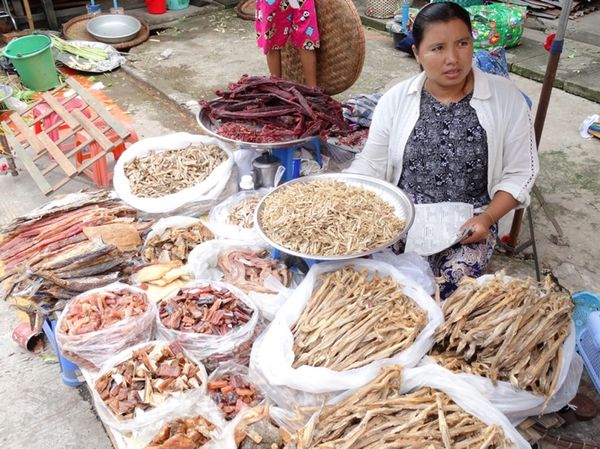
Regarding the location of purchase, fresh fish was mainly purchased from village wet markets, then from travelling vendors, and wet markets in urban areas. It is found that buying directly from fishers was the preferred way of purchase.
|
Delta & Coastal region |
Central Dry Zone |
Hilly Region | ||||||
|---|---|---|---|---|---|---|---|---|
| Source | Ayeyarwady | Yangon | Bago | Mon | Sagaing | Mandalay | Kayin | Shan North |
| from purchase | 61% | 80% | 81% | 76% | 69% | 69% | 67% | 17% |
| from own production | 54% | 19% | 18% | 32% | 8% | 3% | 20% | 18% |
| from gift | 1% | 3% | 5% | 0% | 5% | 0% | 2% | 1% |
Less than half of the households from Ayeyarwady and Bago (40%) bought fresh fish from travelling vendors, and only 10% to 30% responded households bought from travelling venders in other areas. 83% of the households from Mon bought fresh fish from rural wet markets, with around 50% of the households from Mandalay, Sagaing and Shan North. The percentage was lower in Ayeyarwady, Bago and Kayin.
In Mandalay and Yangon, most responded households bought fresh fish from urban wet markets, accounting for 50% and 35%, respectively, whereas the other areas ranged between 5% and 10%. In all surveyed areas, between 5% and 20% of the households bought fresh fish from fishers, and buying from village stores and fish wholesaler was less common.
Source of dried fish consumed
More than 46% of the households purchased dried fish with the week. In particular, 72% of the households from Mandalay bought dried fish they consumed in the past week while only 16 % of the households from Shan North bought dried fish they consumed (Table 16). Less than 30% of participant households produced their own dried fish in Ayeyarwady and Mon. Receiving dried fish as a gift was rare (< 5%).
|
Delta & Coastal region |
Central Dry Zone |
Hilly Region | ||||||
|---|---|---|---|---|---|---|---|---|
| Source | Ayeyarwady | Yangon | Bago | Mon | Sagaing | Mandalay | Kayin | Shan North |
| from purchase | 31% | 64% | 51% | 49% | 38% | 72% | 54% | 16% |
| from own production | 24% | 9% | 19% | 30% | 0% | 0% | 19% | 2% |
| from gift | 2% | 2% | 3% | 1% | 2% | 2% | 3% | 0% |
Purchasing dried fish from village wet markets was common in Ayeyarwady, Bago, and Mon (Figure 36). In these areas, 84% of the respondents bought dried fish from village wet markets. It was fewer in other areas, which is less than 30% in the Dry Zone, Mandalay and Sagaing.
In Yangon and Mandalay, purchases from the urban market were higher than compared to anywhere else, ranging from a minimum of 15% to a maximum of 30%. Purchases from travel vendors were around 10% and no products were purchased from travelling vendors in Mandalay and Northern Shan. Purchases from fishers and wholesalers were almost non-existent, with only 5% in some areas.
Source of dried shrimp consumed
50% of dried shrimp was purchased, with only 10% producing dried shrimp at home and less than 5% receiving it as a gift (Table 17).
|
Delta & Coastal region |
Central Dry Zone |
Hilly Region | ||||||
|---|---|---|---|---|---|---|---|---|
| Source | Ayeyarwady | Yangon | Bago | Mon | Sagaing | Mandalay | Kayin | Shan North |
| from purchase | 31% | 49% | 22% | 26% | 19% | 15% | 32% | 0% |
| from own production | 9% | 3% | 6% | 3% | 0% | 0% | 9% | 0% |
| from gift | 2% | 1% | 4% | 2% | 0% | 2% | 2% | 0% |
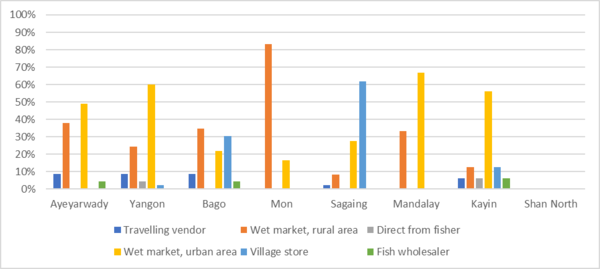
In Sagaing and Bago, more than 50% of the respondents bought dried shrimp from the urban wet markets while purchases from rural wet markets were the highest in Mon State with over 80% (Figure 37). Purchases from travel vendors were below 10% and direct purchases from fish wholesalers and fishers account for slightly over 5%. Purchases from village stores were common, except in Bago and Sagaing.
Source of fermented fish consumed
Purchasing fermented products is very common (Table 18). It is the highest in Sagaing with 82%, followed by Ayeyarwady, Mandalay, Yangon and Mon State (61%, 65%, 69%, 61% respectively), while it is the lowest in the Northern Shan State with 5%.
Own-production is common in Bago (52%), but there is no own-production in the central and Hilly Regions. Own-production ranges between 15% to 30% in other states and regions. Fermented products are rarely received as gifts (3%).
|
Delta & Coastal region |
Central Dry Zone |
Hilly Region | ||||||
|---|---|---|---|---|---|---|---|---|
| Source | Ayeyarwady | Yangon | Bago | Mon | Sagaing | Mandalay | Kayin | Shan North |
| from purchase | 61% | 69% | 38% | 61% | 82% | 65% | 39% | 5% |
| from own production | 29% | 17% | 52% | 22% | 0% | 0% | 37% | 0% |
| from gift | 1% | 2% | 2% | 1% | 0% | 0% | 3% | 0% |
A majority of fermented products were bought from rural wet markets with the highest rate of approximately 90% in Mon State, followed by Shan North with more than 60% (Figure 38). In Bago, Ayeyarwady and Yangon, rural wet market accounted for around 50%. On the other hand, purchases from urban wet markets account for 70% in Mandalay, followed by 10%, 30% in Ayeyarwady and Yangon, and for 5% to 10% in Bago, Kayin, Mon and Sagaing.
It is found that 56% of the respondents in Sagaing bought fish products from villages stores, followed by 33% in Kayin and Shan North with the lowest in Bago, Mon and Yangon with 5% to 10%. Purchases from fish wholesalers or directly from fisher were found in Kayin, Yangon, and Ayeyarwady; however, it was less than 10% in each area.
Source of salted fish consumed
Salted fish is mainly purchased (Table 19). In Sagaing, 82% of respondents bought their salted fish in a week. Own-production was highest in Bago with 52% and it ranges between 17 % to 30% in most of the other areas, with no own-production in Mandalay and Shan North. Receiving salted fish as a gift was rather uncommon (3%).
|
Delta & Coastal region |
Central Dry Zone |
Hilly Region | ||||||
|---|---|---|---|---|---|---|---|---|
| Source | Ayeyarwady | Yangon | Bago | Mon | Sagaing | Mandalay | Kayin | Shan North |
| from purchase | 61% | 69% | 38% | 61% | 82% | 65% | 39% | 5% |
| from own production | 29% | 17% | 52% | 22% | 0% | 0% | 37% | 0% |
| from gift | 1% | 2% | 2% | 1% | 0% | 0% | 3% | 0% |
There was almost no purchase of salted fish from village stores and fish wholesalers (Figure 39), while purchases from rural wet markets were very common, followed by urban wet markets and travel vendors or directly from fishers.
95% of respondents from Shan North purchase salted fish form rural wet markets, followed by more than half of respondents in Ayeyarwady, Kayin and Mon, whereas purchasing from rural wet markets was lowest in Yangon with 33% of respondents. Purchases from the rural wet market were not observed in Bago.
In Yangon, Bago, and Mandalay, more than half of the respondents purchased salted fish from urban wet markets (67% and 50%, respectively). In Kayin and Mon, 25% of the respondents purchased salted fish from urban wet markets, and over a third of the respondents from Sagaing also did. There were no purchases from urban wet markets in Ayeyarwady and Shan North.
Purchasing salted fish from travelling vendors was most common in Bago with 50%, followed by 25% in Ayeyarwady. Respondents from other states and regions are not purchasing salted fish from travelling vendors. Buying salted fish from fishers is not very common in most of the states and regions, except in Ayeyarwady and Sagaing, accounting for 13% and 18%.
Source of smoked fish consumed
The purchases and own-production of smoked fish were low in most of the surveyed areas, which was between 1% and 7% (Table 20).
|
Delta & Coastal region |
Central Dry Zone |
Hilly Region | ||||||
|---|---|---|---|---|---|---|---|---|
| Source | Ayeyarwady | Yangon | Bago | Mon | Sagaing | Mandalay | Kayin | Shan North |
| from purchase | 0% | 2% | 0% | 1% | 0% | 3% | 7% | 0% |
| from own production | 2% | 2% | 1% | 5% | 0% | 0% | 5% | 1% |
| from gift | 0% | 0% | 0% | 0% | 0% | 0% | 0% | 0% |
Predominantly, households bought smoked fish from rural and urban wet markets, and secondly from fishers (Figure 40). Village stores were the least common location of purchase.
Source of other fish products consumed
Purchasing rates of any other fish products ranged from 1% to 17% and own-productions ranged between 1% and 10% (Table 21). Receiving any other fish products as a gift was not significant.
|
Delta & Coastal region |
Central Dry Zone |
Hilly Region | ||||||
|---|---|---|---|---|---|---|---|---|
| Source | Ayeyarwady | Yangon | Bago | Mon | Sagaing | Mandalay | Kayin | Shan North |
| from purchase | 1% | 7% | 5% | 17% | 10% | 14% | 13% | 12% |
| from own production | 1% | 1% | 3% | 7% | 0% | 0% | 7% | 1% |
| from gift | 0% | 0% | 1% | 0% | 0% | 0% | 2% | 2% |
Other fish products were mainly purchased from rural and urban wet markets, followed by village stores (Figure 41). In Ayeyarwady, Mon State and Shan North, the majority of respondents purchased any other fish products from rural wet markets, whereas respondents from Yangon, Mandalay and Sagaing preferred urban wet markets. Village stores were the third most common location for purchases, especially in Bago with 60% of the respondents. Purchases from travelling vendors and fisher were less than 10%.
Source of other processed fish consumed
Processed fish was preferred to be purchased rather than own-produced (Table 22). Yangon had the highest purchase rate of 94% for any kind of processed fish, followed by Mandalay and Sagaing with over 80%. In Ayeyarwady, Bago, Kayin and Mon, over 70% of respondents purchased processed fish, and it was lowest in Shan North with 38%. Similar to previous results, own-production of any processed fish was highest in Bago with 65%. In regions located nearby rivers and sea (Ayeyarwady, Kayin, Mon State, and Yangon) production provided as the main source with average 40%. On the other hand, it was the lowest in the Dry Zone and Hilly Region. Receiving any processed fish as a gift was not very common (around 10%).
|
Delta & Coastal region |
Central Dry Zone |
Hilly Region | ||||||
|---|---|---|---|---|---|---|---|---|
| Source | Ayeyarwady | Yangon | Bago | Mon | Sagaing | Mandalay | Kayin | Shan North |
| from purchase | 76% | 94% | 75% | 78% | 87% | 86% | 79% | 38% |
| from own production | 46% | 26% | 65% | 41% | 4% | 0% | 50% | 3% |
| from gift | 4% | 6% | 10% | 3% | 2% | 3% | 8% | 3% |
Rural wet markets were the most usual place to purchase any processed fish, except for the Dry Zone (Figure 42). Urban wet markets were the second most usual place followed by village stores. The percentages for the other three locations were not significant.
In Mon State, 83% of the households preferred to buy any processed fish from rural wet markets, and that of 65% in Shan North. In Ayeyarwady and Bago, less than half of the households bought processed fish from rural wet markets, while over a third of the households in Yangon and Mandalay, and a fourth in Kayin went to rural wet markets.
Urban wet markets were more popular among responded households living in Mandalay and Yangon, with 65% and 37%, respectively. They were also popular in Ayeyarwady and Kyain, whereas less so in other states and regions. Purchases from urban wet markets had the lowest rate in Shan North with 8%.
Between 1% and 15% of the households bought processed fish from travelling vendors, whereas 1% to 10% of the households bought it from fish wholesalers. Processed fish was rarely purchased from fishers with less than 10%.
Source of any fish consumed
Responded households from targeted areas were primarily buying any kind of fish; the lowest rate was 50% in Shan North (Table 23). The Dry Zone rarely produced their consumed fish and fish products whereas receiving gifts was infrequent across all areas.
|
Delta & Coastal region |
Central Dry Zone |
Hilly Region | ||||||
|---|---|---|---|---|---|---|---|---|
| Source | Ayeyarwady | Yangon | Bago | Mon | Sagaing | Mandalay | Kayin | Shan North |
| from purchase | 80% | 99% | 91% | 92% | 99% | 94% | 86% | 50% |
| from own production | 63% | 37% | 66% | 45% | 8% | 3% | 53% | 19% |
| from gift | 5% | 8% | 12% | 4% | 8% | 3% | 11% | 5% |
The most preferred locations to purchase any kind of fish were rural wet markets, except in Mandalay, and urban wet markets (Figure 43). Travelling vendors and village stores were the third most usual purchasing places, whereas purchases from fish wholesalers and fishers were less common.
Responded households from Mon and Shan North preferred to purchase any kind of fish from rural wet markets, as did households from Ayeyarwady, Mandalay, Bago, Yangon, and Sagaing, while it is not very common in Kayin (23.6%).
Households living near big cities like Yangon and Mandalay were more likely to go to urban wet markets than rural wet markets, and 59% of the respondents from Mandalay went to urban wet markets. In the rest areas, urban wet markets were not as popular as rural ones, with only 7% in Mon State.
More than a quarter of the respondents from Ayeyarwady and Bago, around 10% from Yangon and Kayin purchased any kind of fish from travelling vendors. In Mon, Sagaing, and Shan North, less than 10% purchased fish from travelling vendors, with no purchases at all in Mandalay.
In Sagaing, 32% of the respondents bought fish from village stores, followed by over 20% in Kayin. The purchasing rate from village stores was over 10% in Shan North and Bago. It was below 5% in the remaining areas.
Purchases from fishers and fish wholesalers were low (maximum 10%), with no purchases in Mon State, Mandalay and Shan North.
Discussion
The consumptions of both processed and fresh fish were mainly observed in the Delta and Coastal Region, and the proximity to the production area seems to influence consumers’ options and preferences. It is difficult to get marine fish in the Northern Shan when Sagaing and Mandalay consumed more fresh fish (79% and 72% of total fish consumption). The reason can be that these Regions are where aquaculture businesses thrive.
The diversity of the fish products primarily based on the location cannot be ignored. There are varieties of fermented fish and shrimp in terms of fish species, process, ingredients, and preparations. For instance, 46 fish species alone were reported for consuming as dried fish. Likewise, preparation of watery fermented fish (Nga-pi-yay) is different in Mon and Kayin from how people eat it in Ayeyarwady or the Dryzone. The location of the fish product or the ethic group name is used to distinct how it is processed and prepared, e.g., Kayin Nga-pi-Yay.
Fresh fish and processed fish products have a significant role in daily diet and nutrition. Nearly 960 responded households except from the Northern Shan reported that their families consumed at least one type of fresh fish or processed fish in the last seven day. They mostly consumed fermented fish, and dried fish and shrimp. Salted fish and smoked fish were the second least preferable followed by canned fish. Not surprisingly, Nga-pi-yay produced from freshwater fish was the most consumed fermented fish (48%) with the highest consumption rates (Nga-pi-yay (freshwater) – 12g/capita/day, Nga-pi-yay (marinet) – 3g/capita/day, Myin-nga-pi – 3.5g/capita). The similar consumption pattern was observed by Needham and Funge-Smith [9]. Most respondents could not identify the exact fermented fish species they consumed except fermented shrimp.
The average per capita consumption of fish and fish products in the surveyed area was 67.16kg annually. Ayeyarwady has the highest fish consumption with 100g/capita/day. It is considerably higher than the national average consumption from the Household Income and Expenditure Survey 2006, which is 21kg/capita/year [10]. The surveyed average of dried and processed fish products was 293g/capita/day, which gets as high as 106.95kg/capita/year when the daily consumption was multiplied to estimate and compare with the existing national representative household data from 2010. The representative household data indicates the yearly average of dried and processed fish consumption is 6.3kg/capita [11].
One of the reasons of over estimation can be that the survey was designed with multiple specific questions on the fish products and the estimation of the households can be slightly skewed when they were asked to recall the types of fish and the amount of fish they consumed in the last week. The pattern of having higher amount of consumption estimation reported than in national statistics can be seen in “Consumption of and the yield of fish and other aquatic animals from the lower Mekong Basin” report [12], which based on surveys that were specifically about consumption. This suggest that asking detailed and specific questions about fish consumption elicit more detailed information, although there may also be a possibility that this encourages over reporting. The other reason is that it is rare to measure the ingredients in cooking in the country, thus it is impossible to get exact weights or amounts that the households consumed but to estimate. The large number of fishing households in the sample might also have led to selection of households with high average fish consumption.
A trend of higher consumption from own production can been seen across all categories of fish products in Mon, Bago, Kayin and Ayeyarwady while 46% of the household purchased their dried fish. Most of the selected households from these areas are from fisheries communities because NAG works in fisheries in these areas. The dried fish consumption is highest in Mandalay and Mon with 20g/capita/day. Among eleven categories (Table 14) dried Bombay Duck is the most consumed dried fish especially in Mon with 8g, in which dried Bombay Duck is mainly produced. Very-small-size-shrimp is the most consumable dried shrimp. 23% of total responded households consumed dried shrimp at least once in a week.
Annex 1: Sample size and number of participating households
| State and Region | Sample Township | Total Household in sample Township | Sample Household | Sample villages per township | Total sample villages |
|---|---|---|---|---|---|
| Ayeyarwady Region | 13 | 29819 | 200 | 3 | 40 |
| Yangon Region | 4 | 79479 | 100 | 5 | 20 |
| Bago Region | 3 | 6323 | 100 | 7 | 20 |
| Mon State | 5 | 8335 | 100 | 4 | 20 |
| Sagaing Region | 6 | 104335 | 150 | 5 | 30 |
| Mandalay Region | 4 | 136613 | 150 | 8 | 30 |
| Kayin State | 2 | 4812 | 100 | 10 | 20 |
| Shan (N) State | 2 | 5938 | 100 | 10 | 20 |
| Magway Region | 3 | 25187 | 100 | 7 | 20 |
| Total | 42 | 400841 | 1100 | 5 | 220 |
| State and Region | Township | Number of interviews |
| Ayeyarwady | Bogale | 20 |
| Dadaye | 20 | |
| Danubyu | 1 | |
| Kyaik Lat | 18 | |
| Labutta | 15 | |
| Maubin | 13 | |
| Mawlamyinegyun | 17 | |
| Pantanaw | 1 | |
| Pyapon | 26 | |
| Yegyi | 15 | |
| Zalun | 1 | |
| Bago | Kawa | 37 |
| Thanatpin | 31 | |
| Waw | 35 | |
| Kayin | Hlaingbwe | 51 |
| Hpa-An | 52 | |
| Mandalay | Pyawbwe | 42 |
| Yamethin | 23 | |
| Mon | Bilin | 25 |
| Chaungzon | 10 | |
| Kyaikto | 26 | |
| Paung | 33 | |
| Thaton | 6 | |
| Sagaing | Bamauk | 36 |
| Kani | 31 | |
| Kyun Hla | 149 | |
| Monywa | 1 | |
| Myaung | 25 | |
| Shan (North) | Mongyai | 50 |
| Tangyan | 60 | |
| Yangon | Kayan | 15 |
| Kungyangon | 26 | |
| Kyauk Tan | 24 | |
| Thongwa | 25 | |
| Total | 960 |
Annex 2: Major marine organisms used to produce processed fish in Myanmar
| Product type | Myanmar name | English name | Scientific name | Habitat |
|---|---|---|---|---|
| Dried fish | Unknown species | |||
| Nga-ni-tu | Anchovy | Stolephorus indicus | Marine; brackish | |
| Belar | Snakeskin gourami | Trichogaster pectoralis | Freshwater | |
| Nga-khone-ma | Swamp barb | Puntius chola | Freshwater | |
| Nga-de | Bearded eel goby | Taenioides cirratus | Marine; freshwater; brackish | |
| Nga-nu-than | Butter catfish | Ompok bimaculatus | Freshwater; brackish | |
| Ka-bhi-lu | Flathead grey mullet | Mugil cephalus | Marine; freshwater; brackish | |
| Nga-hnat | Bombay Duck | Harpadon nehereus | Marine; brackish | |
| Nga-pa-lway | Brushtooth Lizardfish | Saurida undosquamis | Marine | |
| Nga-khoo | Catfish | Clarias batrachus | Freshwater; brackish | |
| Nga-bye-ma | Climbing Perch | Anabas testudineus | Freshwater; brackish | |
| Mee-tan-thwae | Goldspotted grenadier anchovy | Coilia dussumieri | Marine; freshwater; brackish | |
| Nga-than-chaik | Dwarf Catfish | Pseudotropius acutirostris | Freshwater | |
| Nga-shint | Cuchia | Monopterus cuchia | Freshwater; brackish | |
| Nga-zin-pyar | Burmese River ilisha | Ilisha novacula | Freshwater | |
| Nga-tee | False Travally | Lactarius lactarius | Marine; brackish | |
| Nga-khwae-shar | Long tongue sole | Cynoglossus lingua | Marine; freshwater; brackish | |
| Nga-pyan | Sailfin flyingfish | Parexocoetus brachypterus | Marine; | |
| Nga-eike | Eel-tailed catfish | Tandanus tandanus | Freshwater; | |
| Nga-bat | Wallago | Wallago attu | Freshwater; brackish | |
| Nga-yaung | Giant catfish | Arius thalassinus | Marine; freshwater; brackish | |
| Nga-tha-lauk | Hilsa Shad | Tenualosa ilisha | Marine; freshwater; brackish | |
| Pa-la-tu | Indian mackerel | Rastrelliger kanagurta | Marine | |
| Nga-kwin-shat | Indo-Pacific king mackerel | Scomberomorus guttatus | Marine; brackish; | |
| Ka-ka-dit | Barramundi | Lates calcarifer | Marine; freshwater; brackish | |
| Nga-wetma | Gangetic leaffish | Nandus nandus | Freshwater; brackish | |
| Nga-tha-le-htoe | Burmese loach | Lepidocephalus berdmorei | Freshwater | |
| Nga-bae-phyu | Longfin Mogarra | Pentaprion longimanus | Marine; brackish | |
| Nga-pone-nar | Paradise threadfin | Polynemus paradiseus | Marine; freshwater; brackish | |
| Nga-moke-phyu | Silver pomfret | Pampus argenteus | Marine; | |
| Nga-pu-tin | Ocellated pufferfish | Tetraodon cutcutia | Freshwater; brackish; | |
| Nga-tan-khon | Largehead hairtail | Trichiurus lepturus | Marine; brackish | |
| Salmon Catfish | Neoarius leptaspis | Marine; freshwater; brackish; | ||
| Atlantic herring | Clupea harengus | Marine; brackish | ||
| Nga-man | Blackspot shark | Carcharhinus sealei | Marine; | |
| Nga-poke-thin | Pama croaker | Otolithoides pama | Marine; freshwater; brackish; | |
| Nga-mway-htoe | Peacock eel | Macrognathus siamensis | Freshwater | |
| Nga-zin-yine | Long whiskers catfish | Mystus gulio | Freshwater; brackish; | |
| Nga-yan | Striped snakehead | Channa striata | Freshwater; brackish; | |
| Nga-tan | Pangas catfish | Pangasius pangasius | Freshwater; brackish; | |
| Kyoe-war | Stripped Goatfish | Upeneus vittatus | Marine; brackish | |
| Ka-ku-yan | Indian threadfin | Polynemus indicus | Marine; brackish; | |
| Ti-lar-bee-yar | Blue tilapia | Oreochromis aureus | Freshwater; brackish | |
| Nga-mae-lone | Chub mackerel | Scomber japonicus | Marine; | |
| Variety Of Small Fish | ||||
| Nga-lake-kyouk | Whiptail Stingrays | Dasyatidae | Marine | |
| Nga-shwe | Yellow Pike Conger | Congresox talabon | Marine; brackish; | |
| Fermented fish | Unknown species | |||
| Nga-khone-ma | Swamp barb | Puntius chola | Freshwater | |
| Nga-lu | Stone roller | Crossochilus latia | Freshwater; brackish | |
| Nga-bye-ma | Climbing Perch | Anabas testudineus | Freshwater; brackish | |
| Ka-ka-dit | Barramundi | Lates calcarifer | Marine; freshwater; brackish | |
| Nga-tan-khon | Largehead hairtail | Trichiurus lepturus | Marine; brackish | |
| Shrimp | ||||
| Nga-phel-oun | Manipur osteobrama | Osteobrama belangeri | Freshwater; | |
| Nga-zin-yine | Long whiskers catfish | Mystus gulio | Freshwater; brackish; | |
| Nga-yan | Striped snakehead | Channa striata | Freshwater; brackish; | |
| Variery of small fish | ||||
| Salted fish | Unknown species | |||
| Nga-khone-ma | Swamp barb | Puntius chola | Freshwater | |
| Ka-be-lu | Squaretail mullet | Ellochelon vaigiensis | Marine; freshwater; brackish | |
| Nga-pa-lway | Brushtooth Lizardfish | Saurida undosquamis | Marine | |
| Nga-lu | Stone roller | Crossochilus latia | Freshwater; brackish | |
| Nga-phel-oun | Manipur osteobrama | Osteobrama belangeri | Freshwater; | |
| Nga-khoo | Catfish | Clarias batrachus | Freshwater; brackish | |
| Nga-bye-ma | Climbing Perch | Anabas testudineus | Freshwater; brackish | |
| Nga-pe | Clown knifefish | Chitala chitala | Freshwater | |
| Nga-eike | Eel-tailed catfish | Tandanus tandanus | Freshwater; | |
| Nga yan-panaw | Spotted snakehead | Ophiocephalus punctatus | Freshwater; brackish; | |
| Nga-bat | Wallago | Wallago attu | Freshwater; brackish | |
| Nga-yaung | Giant catfish | Arius thalassinus | Marine; freshwater; brackish | |
| Nga-tha-lauk | Hilsa Shad | Tenualosa ilisha | Marine; freshwater; brackish | |
| Nga-kwin-shat | Indo-Pacific king mackerel | Scomberomorus guttatus | Marine; brackish; | |
| Ka-ka-dit | Barramundi | Lates calcarifer | Marine; freshwater; brackish | |
| Nga-myin | Silond catfish | Silonia silondia | Freshwater; brackish | |
| Nga-gyin | Mrigal Carp | Cirrhinus cirrhosus | Freshwater; brackish | |
| Nga-phel-oun | Manipur osteobrama | Osteobrama belangeri | Freshwater; | |
| Nga-zin-sat | Indian glassy fish | Parambassis ranga | Freshwater; brackish | |
| Nga-poke-thin | Pama croaker | Otolithoides pama | Marine; freshwater; brackish; | |
| Nga-zin-yine | Long whiskers catfish | Mystus gulio | Freshwater; brackish; | |
| Nga-yan | Striped snakehead | Channa striata | Freshwater; brackish; | |
| Ti-lar-bee-yar | Blue tilapia | Oreochromis aureus | Freshwater; brackish | |
| Smoked fish | Unknown species | |||
| Nga-khoo | Catfish | Clarias batrachus | Freshwater; brackish | |
| Nga-bye-ma | Climbing Perch | Anabas testudineus | Freshwater; brackish | |
| Nga-nu-than | Pabdah catfish | Ompok pabda | Freshwater | |
| Nga-wetma | Gangetic leaffish | Nandus nandus | Freshwater; brackish | |
| Nga-yan | Striped snakehead | Channa striata | Freshwater; brackish; | |
| Ti-lar-bee-yar | Blue tilapia | Oreochromis aureus | Freshwater; brackish | |
| Nga-khone-ma | Swamp barb | Puntius chola | Freshwater | |
| Nga-pa-lway | Brushtooth Lizardfish | Saurida undosquamis | Marine | |
| Nga-eike | Eel-tailed catfish | Tandanus tandanus | Freshwater; | |
| Nga-tha-lauk | Hilsa Shad | Tenualosa ilisha | Marine; freshwater; brackish | |
| Nga-mway-htoe | Peacock eel | Macrognathus siamensis | Freshwater | |
| Nga-pe | Clown knifefish | Chitala chitala | Freshwater | |
| Ka-ka-dit | Barramundi | Lates calcarifer | Marine; freshwater; brackish | |
| Nga-gyi | Stinging catfish | Heteropneustes fossilis | Freshwater; brackish |
Notes
- ↑ Dried Fish Matters. “About ‘Dried Fish Matters,’” March 26, 2018. https://driedfishmatters.org/about/
- ↑ https://www.kobotoolbox.org/
- ↑ Needham and Funge-Smith, “The Consumption of Fish and Fish Products in the Asia-Pacific Region Based on Household Surveys”
- ↑ Antonio, “Patterns of Access to Land by Chinese Agricultural Investors and Their Impacts on Rural Households in Mandalay Region, Myanmar”
- ↑ Belton et al., “Aquaculture in Transition”
- ↑ Belton et al., “Aquaculture in Transition”
- ↑ Naing and Aung, “Prevalence and Risk Factors of Hypertension in Myanmar”
- ↑ Hortle, “Consumption and the Yield of Fish and Other Aquatic Animals from the Lower Mekong Basin”
- ↑ Needham and Funge-Smith, “The Consumption of Fish and Fish Products in the Asia-Pacific Region Based on Household Surveys”
- ↑ Needham and Funge-Smith, “The Consumption of Fish and Fish Products in the Asia-Pacific Region Based on Household Surveys”
- ↑ Belton et al., “Aquaculture in Transition”
- ↑ Hortle, “Consumption and the Yield of Fish and Other Aquatic Animals from the Lower Mekong Basin”
