Gallery of new files
From DFM Wiki
This special page shows the last uploaded files.
 Figure 15 - Percentage of any fresh fish purchased, by location of purchase.svg Smecker
17:13, 27 May 2021
2,097 × 813; 10 KB
 Figure 14 - Average number of times consumed in past 7 days.svg Smecker
17:12, 27 May 2021
2,107 × 950; 19 KB
 Figure 13 - Per capita consumption of all the category of fish involved in the study.svg Smecker
17:10, 27 May 2021
2,098 × 1,043; 32 KB
 Figure 12 - Per capita consumption of 'smoked fish' per day.svg Smecker
17:09, 27 May 2021
2,112 × 884; 11 KB
 Figure 11- Per capita consumption of 'salted fish' per day.svg Smecker
17:09, 27 May 2021
2,171 × 879; 17 KB
 Figure 10 - Per capita consumption of 'dried shrimp' per day.svg Smecker
17:08, 27 May 2021
2,135 × 838; 17 KB
 Figure 9 - Per capita consumption of 'most consuming dried fish' per day.svg Smecker
17:05, 27 May 2021
2,123 × 795; 15 KB
 Figure 8b - Per capita consumption of 'most consuming fermented products' per day.svg Smecker
17:04, 27 May 2021
2,209 × 1,085; 16 KB
 Figure 8a - Per capita consumption of 'most consuming fermented products' per day.svg Smecker
17:03, 27 May 2021
2,209 × 1,100; 13 KB
 Figure 7 - Per capita consumption of 'fresh fish' per day.svg Smecker
17:02, 27 May 2021
2,128 × 795; 15 KB
 Figure 6 - Percentage of household consuming 'any fresh fish' and 'any processed fish' in past 7 days, by region.svg Smecker
16:20, 27 May 2021
1,995 × 1,049; 9 KB
 Figure 5 - Percentage of household consuming 'any fish' in past 7 days, by region.svg Smecker
16:18, 27 May 2021
1,653 × 993; 6 KB

 Figure 3 - Respondent's composition by geographical location.svg Smecker
16:01, 27 May 2021
1,615 × 833; 4 KB
 Figure 2-Seven components of the survey questionnaire.svg Smecker
15:41, 27 May 2021
1,595 × 852; 8 KB

 Cambodia processed fish production by province 2014-2018.svg EricThrift
10:32, 29 April 2021
1,653 × 993; 13 KB
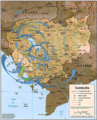
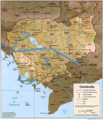 Cambodia processors fresh fish buying sources map.png EricThrift
14:19, 28 April 2021
777 × 909; 1.75 MB
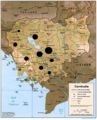
 Cambodia processors dried fish sales destinations map.png EricThrift
14:18, 28 April 2021
745 × 919; 1.69 MB


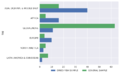
 Zotero graph- dried fish and general fisheries sample by theme.png EricThrift
15:38, 9 April 2021
761 × 471; 30 KB
 Zotero graph- Spatial variation in dried fish and general fisheries literatures.png EricThrift
15:36, 9 April 2021
759 × 471; 26 KB

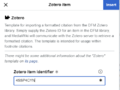
 Item search results and key from the Zotero web library.png EricThrift
14:31, 9 April 2021
493 × 303; 15 KB

 Indonesia end uses of marine fishery production.svg EricThrift
13:52, 9 April 2021
1,653 × 1,551; 49 KB
 Dried fish literature review - Total number of references of direct and indirect relevance to dried fish by country (2019).svg EricThrift
12:16, 9 April 2021
1,653 × 993; 7 KB
 Dried fish literature review - Count of directly relevant primary tags by country (2019).svg EricThrift
12:16, 9 April 2021
2,052 × 1,373; 15 KB
 Dried fish literature review - count of indirect value chain segment tags by country (2019).svg EricThrift
12:16, 9 April 2021
1,653 × 993; 10 KB
 Dried fish literature review - Count of indirectly relevant primary tags by country (2019).svg EricThrift
12:16, 9 April 2021
2,148 × 1,244; 17 KB
 Dried fish literature review - Count of direct value chain segment tags by country (2019).svg EricThrift
12:16, 9 April 2021
1,653 × 993; 10 KB

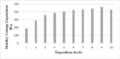 Sri Lanka average monthly household expenditures on dried fish by decile.png EricThrift
16:57, 5 April 2021
697 × 341; 20 KB

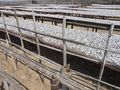
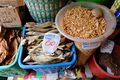 Dried-fish-products-at-general-store-Bergala-Sri-Lanka-2.jpg EricThrift
17:14, 31 March 2021
4,896 × 3,264; 6.08 MB
 Sri Lanka average monthly household expenditure on meat.jpg EricThrift
16:44, 31 March 2021
383 × 490; 39 KB
 Sri Lanka dried fish literature thematic distribution.svg EricThrift
14:13, 31 March 2021
2,137 × 1,020; 9 KB
 Sri Lanka average monthly household expenditure on dried fish and meat as percentages of the total food basket .svg EricThrift
13:53, 31 March 2021
2,148 × 859; 16 KB
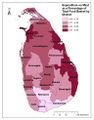
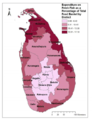
 Sri Lanka expenditure on fresh fish as a percentage of total food basket by district.png EricThrift
13:48, 31 March 2021
323 × 400; 122 KB
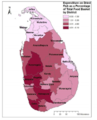
 Sri Lanka expenditure on dried fish as a percentage of total food basket by district.png EricThrift
13:47, 31 March 2021
313 × 408; 124 KB
 Sri Lanka average monthly household expenditure on dried fish by district, 2016.svg EricThrift
13:42, 31 March 2021
1,906 × 927; 13 KB
 Sri Lanka share of dried fish in average monthly household expenditure on selected animal food items.svg EricThrift
13:41, 31 March 2021
1,653 × 993; 7 KB


.svg)


.svg)
.svg)
.svg)
.svg)
.svg)


