Uploads by Smecker
From DFM Wiki
This special page shows all uploaded files.
| Date | Name | Thumbnail | Size | Description | Versions |
|---|---|---|---|---|---|
| 11:56, 21 May 2021 | Surveyed Townships Location Map (Myanmar MDFCS).svg (file) | .svg) |
124 KB | Uploaded a work by Si Thu Lin, Research Assistant at Network Activities Group, Myanmar from DFM Report Draft on the Myanmar Dried Fish Consumption Survey (MDFCS) with UploadWizard | 1 |
| 14:41, 27 May 2021 | Figure 2-Seven components of the survey questionnaire.svg (file) |  |
8 KB | Uploaded a work by Si Thu Lin, Research Assistant at Network Activities Group, Myanmar from DFM Report Draft (11.12.20)_BH (Myanmar Dried Fish Consumption Survey Methodology section) with UploadWizard | 1 |
| 15:01, 27 May 2021 | Figure 3 - Respondent's composition by geographical location.svg (file) |  |
4 KB | Uploaded a work by Si Thu Lin, Research Assistant at Network Activities Group, Myanmar from DFM Report Draft (11.12.20)_BH (Myanmar Dried Fish Consumption Survey Results section) with UploadWizard | 1 |
| 15:05, 27 May 2021 | Figure 4 - Ethnicity of respondents by region.svg (file) |  |
10 KB | Uploaded a work by Si Thu Lin, Research Assistant at Network Activities Group, Myanmar from DFM Report Draft (11.12.20)_BH (Myanmar Dried Fish Consumption Survey Results section) with UploadWizard | 1 |
| 15:18, 27 May 2021 | Figure 5 - Percentage of household consuming 'any fish' in past 7 days, by region.svg (file) |  |
6 KB | Uploaded a work by Si Thu Lin, Research Assistant at Network Activities Group, Myanmar from DFM Report Draft (11.12.20)_BH (Myanmar Dried Fish Consumption Survey Results section) with UploadWizard | 1 |
| 15:20, 27 May 2021 | Figure 6 - Percentage of household consuming 'any fresh fish' and 'any processed fish' in past 7 days, by region.svg (file) |  |
9 KB | Uploaded a work by Si Thu Lin, Research Assistant at Network Activities Group, Myanmar from DFM Report Draft (11.12.20)_BH (Myanmar Dried Fish Consumption Survey Results section) with UploadWizard | 1 |
| 16:02, 27 May 2021 | Figure 7 - Per capita consumption of 'fresh fish' per day.svg (file) |  |
15 KB | Uploaded a work by Si Thu Lin, Research Assistant at Network Activities Group, Myanmar from DFM Report Draft (11.12.20)_BH (Myanmar Dried Fish Consumption Survey Results section) with UploadWizard | 1 |
| 16:03, 27 May 2021 | Figure 8a - Per capita consumption of 'most consuming fermented products' per day.svg (file) |  |
13 KB | Uploaded a work by Si Thu Lin, Research Assistant at Network Activities Group, Myanmar from DFM Report Draft (11.12.20)_BH (Myanmar Dried Fish Consumption Survey Results section) with UploadWizard | 1 |
| 16:04, 27 May 2021 | Figure 8b - Per capita consumption of 'most consuming fermented products' per day.svg (file) |  |
16 KB | Uploaded a work by Si Thu Lin, Research Assistant at Network Activities Group, Myanmar from DFM Report Draft (11.12.20)_BH (Myanmar Dried Fish Consumption Survey Results section) with UploadWizard | 1 |
| 16:05, 27 May 2021 | Figure 9 - Per capita consumption of 'most consuming dried fish' per day.svg (file) |  |
15 KB | Uploaded a work by Si Thu Lin, Research Assistant at Network Activities Group, Myanmar from DFM Report Draft (11.12.20)_BH (Myanmar Dried Fish Consumption Survey Results section) with UploadWizard | 1 |
| 16:08, 27 May 2021 | Figure 10 - Per capita consumption of 'dried shrimp' per day.svg (file) |  |
17 KB | Uploaded a work by Si Thu Lin, Research Assistant at Network Activities Group, Myanmar from DFM Report Draft (11.12.20)_BH (Myanmar Dried Fish Consumption Survey Results section) with UploadWizard | 1 |
| 16:09, 27 May 2021 | Figure 11- Per capita consumption of 'salted fish' per day.svg (file) |  |
17 KB | Uploaded a work by Si Thu Lin, Research Assistant at Network Activities Group, Myanmar from DFM Report Draft (11.12.20)_BH (Myanmar Dried Fish Consumption Survey Results section) with UploadWizard | 1 |
| 16:09, 27 May 2021 | Figure 12 - Per capita consumption of 'smoked fish' per day.svg (file) |  |
11 KB | Uploaded a work by Si Thu Lin, Research Assistant at Network Activities Group, Myanmar from DFM Report Draft (11.12.20)_BH (Myanmar Dried Fish Consumption Survey Results section) with UploadWizard | 1 |
| 16:10, 27 May 2021 | Figure 13 - Per capita consumption of all the category of fish involved in the study.svg (file) |  |
32 KB | Uploaded a work by Si Thu Lin, Research Assistant at Network Activities Group, Myanmar from DFM Report Draft (11.12.20)_BH (Myanmar Dried Fish Consumption Survey Results section) with UploadWizard | 1 |
| 16:12, 27 May 2021 | Figure 14 - Average number of times consumed in past 7 days.svg (file) |  |
19 KB | Uploaded a work by Si Thu Lin, Research Assistant at Network Activities Group, Myanmar from DFM Report Draft (11.12.20)_BH (Myanmar Dried Fish Consumption Survey Results section) with UploadWizard | 1 |
| 16:13, 27 May 2021 | Figure 15 - Percentage of any fresh fish purchased, by location of purchase.svg (file) |  |
10 KB | Uploaded a work by Si Thu Lin, Research Assistant at Network Activities Group, Myanmar from DFM Report Draft (11.12.20)_BH (Myanmar Dried Fish Consumption Survey Results section) with UploadWizard | 1 |
| 16:14, 27 May 2021 | Figure 16 - Percentage of any dried fish purchased, by location of purchase.svg (file) |  |
10 KB | Uploaded a work by Si Thu Lin, Research Assistant at Network Activities Group, Myanmar from DFM Report Draft (11.12.20)_BH (Myanmar Dried Fish Consumption Survey Results section) with UploadWizard | 1 |
| 16:15, 27 May 2021 | Figure 17 - Percentage of any dried shrimp purchased, by location of purchase.svg (file) |  |
11 KB | Uploaded a work by Si Thu Lin, Research Assistant at Network Activities Group, Myanmar from DFM Report Draft (11.12.20)_BH (Myanmar Dried Fish Consumption Survey Results section) with UploadWizard | 1 |
| 16:16, 27 May 2021 | Figure 18 - Percentage of any fermented products purchased, by location of purchase.svg (file) |  |
12 KB | Uploaded a work by Si Thu Lin, Research Assistant at Network Activities Group, Myanmar from DFM Report Draft (11.12.20)_BH (Myanmar Dried Fish Consumption Survey Results section) with UploadWizard | 1 |
| 16:17, 27 May 2021 | Figure 19 - Percentage of any salted fish purchased, by location of purchase.svg (file) |  |
11 KB | Uploaded a work by Si Thu Lin, Research Assistant at Network Activities Group, Myanmar from DFM Report Draft (11.12.20)_BH (Myanmar Dried Fish Consumption Survey Results section) with UploadWizard | 1 |
| 16:17, 27 May 2021 | Figure 20 - Percentage of any smoked fish purchased, by location of purchase.svg (file) |  |
8 KB | Uploaded a work by Si Thu Lin, Research Assistant at Network Activities Group, Myanmar from DFM Report Draft (11.12.20)_BH (Myanmar Dried Fish Consumption Survey Results section) with UploadWizard | 1 |
| 16:18, 27 May 2021 | Figure 21 - Percentage of any other fish products purchased, by location of purchase.svg (file) |  |
11 KB | Uploaded a work by Si Thu Lin, Research Assistant at Network Activities Group, Myanmar from DFM Report Draft (11.12.20)_BH (Myanmar Dried Fish Consumption Survey Results section) with UploadWizard | 1 |
| 16:19, 27 May 2021 | Figure 22 - Percentage of any processed fish purchased, by location of purchase.svg (file) |  |
11 KB | Uploaded a work by Si Thu Lin, Research Assistant at Network Activities Group, Myanmar from DFM Report Draft (11.12.20)_BH (Myanmar Dried Fish Consumption Survey Results section) with UploadWizard | 1 |
| 16:20, 27 May 2021 | Figure 23 - Percentage of any fish purchased, by location of purchase.svg (file) |  |
12 KB | Uploaded a work by Si Thu Lin, Research Assistant at Network Activities Group, Myanmar from DFM Report Draft (11.12.20)_BH (Myanmar Dried Fish Consumption Survey Results section) with UploadWizard | 1 |
| 14:50, 15 June 2021 | Appendix 1 - Centrally Sponsored Scheme on Blue Revolution Pattern of Financial Assistance.svg (file) |  |
220 KB | Uploaded a work by National Fisheries Development Board, Government of India from Guidelines Centrally Sponsored Scheme (CSS) on Blue Revolution: Integrated Development and Management of Fisheries Department of Animal Husbandry, Dairying & Fisheries Ministry of Agriculture and Farmers Welfare Government of India Krishi Bhavan, New Delhi with UploadWizard | 1 |
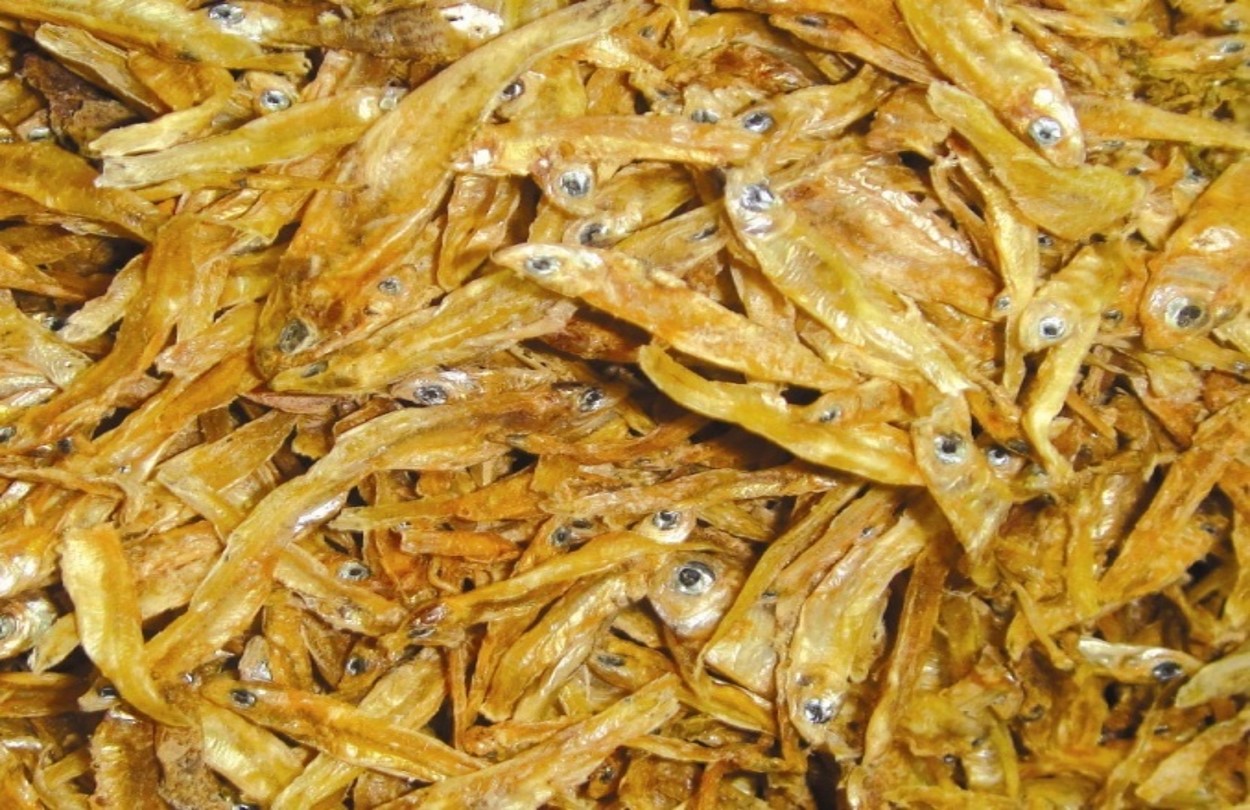
| 13:50, 12 July 2021 | Dried fish (shutki).jpg (file) | .jpg) |
285 KB | Uploaded a work by Mostafa A.R. Hossain from Submitted by author for inclusion in the "Visualizing Social Economies" video presentation. with UploadWizard | 1 |
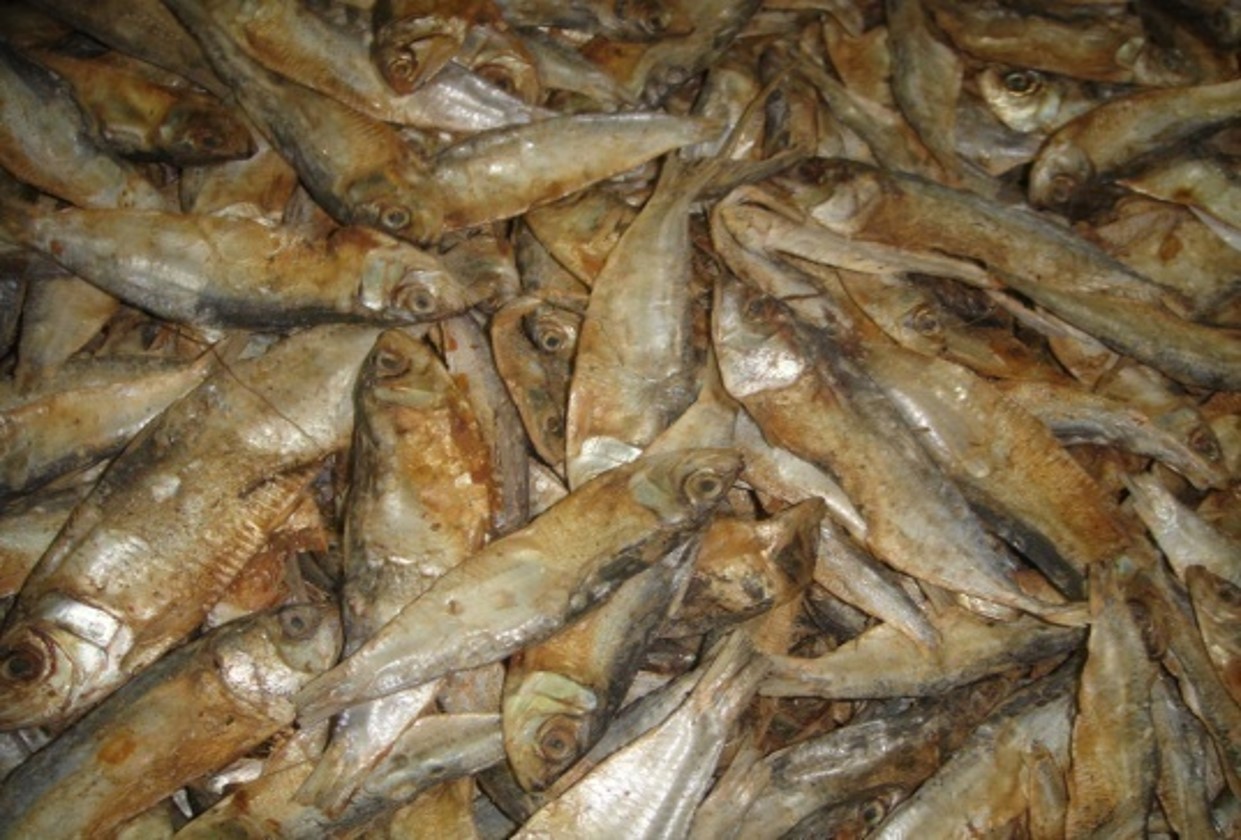
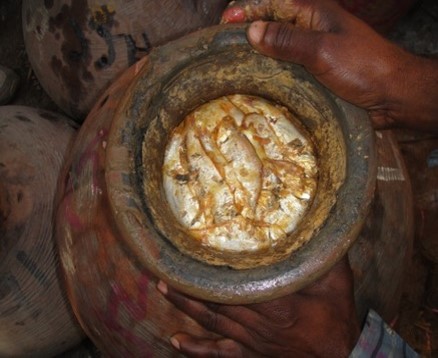
| 13:52, 12 July 2021 | Fermented fish (chapa, shidol).jpg (file) | .jpg) |
224 KB | Uploaded a work by Mostafa A.R. Hossain from Submitted by author for inclusion in the "Visualizing Social Economies" video presentation. with UploadWizard | 1 |
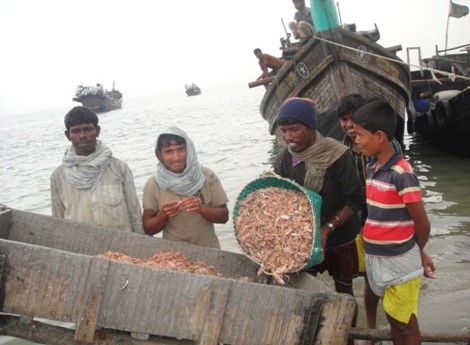
| 14:00, 12 July 2021 | Fish landing Bangladesh.jpg (file) |  |
44 KB | Uploaded a work by Mostafa A.R. Hossain from Submitted by author for inclusion in the "Visualizing Social Economies" video presentation. with UploadWizard | 1 |
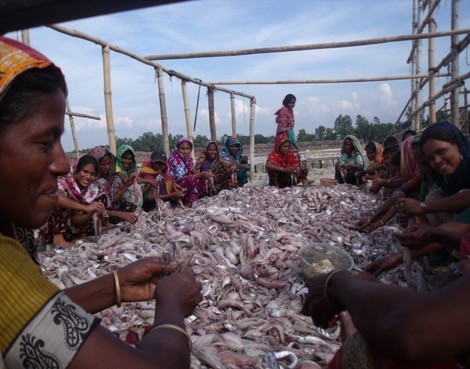
| 14:01, 12 July 2021 | Fish sorting Bangladesh.jpg (file) |  |
59 KB | Uploaded a work by Mostafa A.R. Hossain from Submitted by author for inclusion in the "Visualizing Social Economies" video presentation. with UploadWizard | 1 |
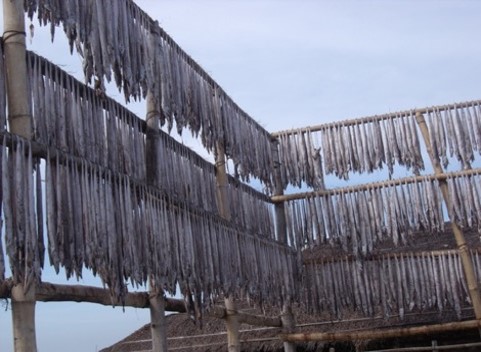
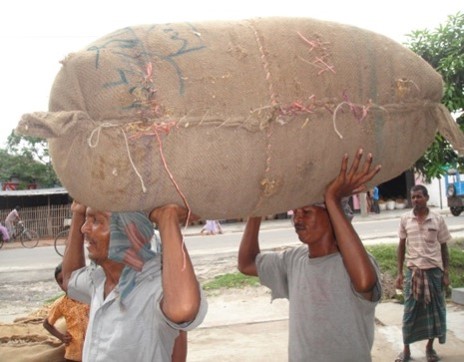
| 14:40, 15 July 2021 | Fish hanging by their tails.jpg (file) |  |
50 KB | Uploaded a work by Mostafa A.R. Hossain from Submitted by author for inclusion in the "Visualizing Social Economies" video presentation. with UploadWizard | 1 |
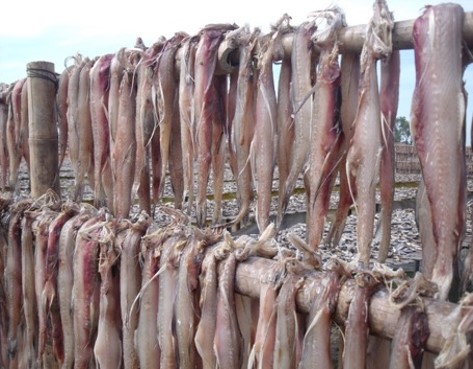
| 14:42, 15 July 2021 | Fish hanging by the jaw.jpg (file) |  |
60 KB | Uploaded a work by Mostafa A.R. Hossain from Submitted by author for inclusion in the "Visualizing Social Economies" video presentation. with UploadWizard | 1 |
| 14:48, 15 July 2021 | Salted fish before drying.jpg (file) |  |
112 KB | Uploaded a work by Mostafa A.R. Hossain from Submitted by author for inclusion in the "Visualizing Social Economies" video presentation. with UploadWizard | 1 |
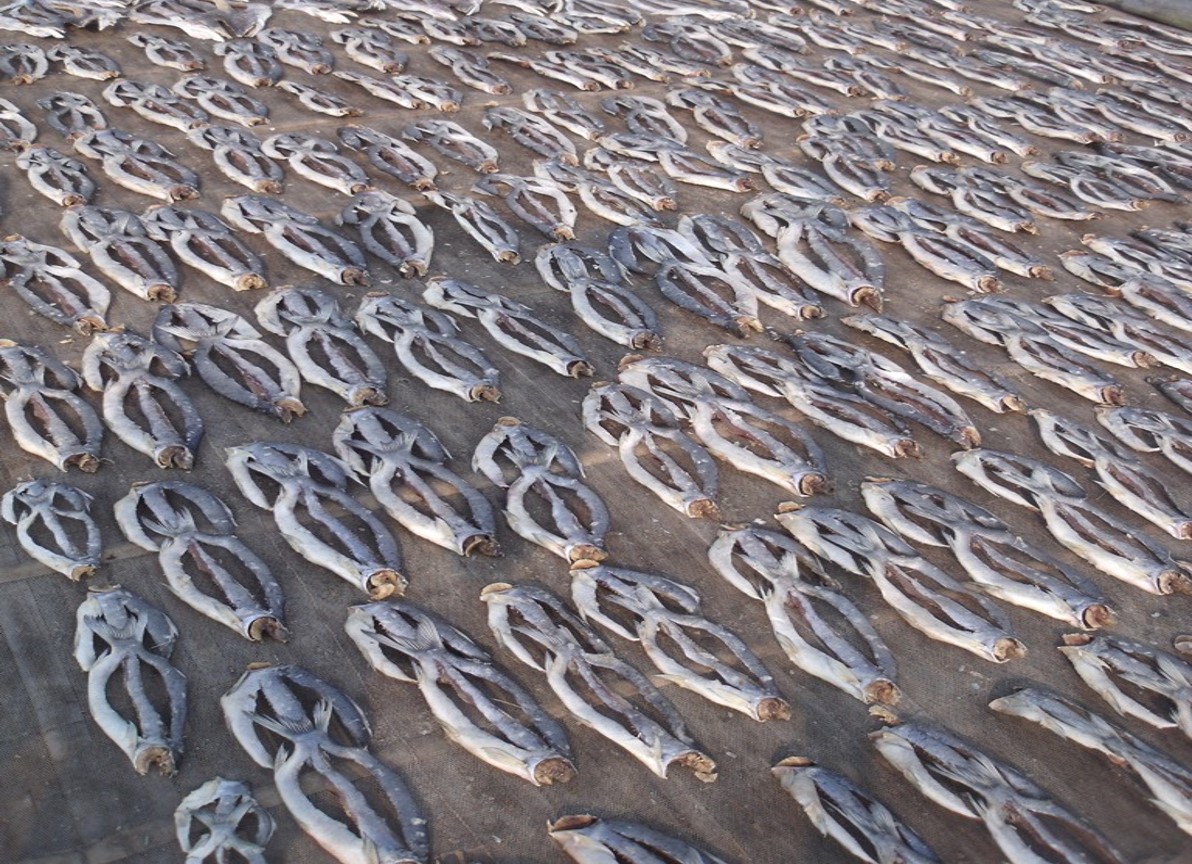
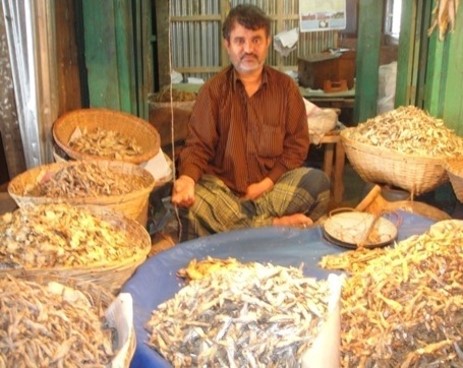
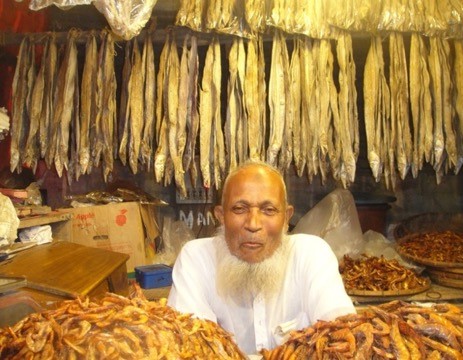
| 15:00, 15 July 2021 | High-value large fish drying.jpg (file) |  |
359 KB | Uploaded a work by Mostafa A.R. Hossain from Submitted by author for inclusion in the "Visualizing Social Economies" video presentation. with UploadWizard | 1 |
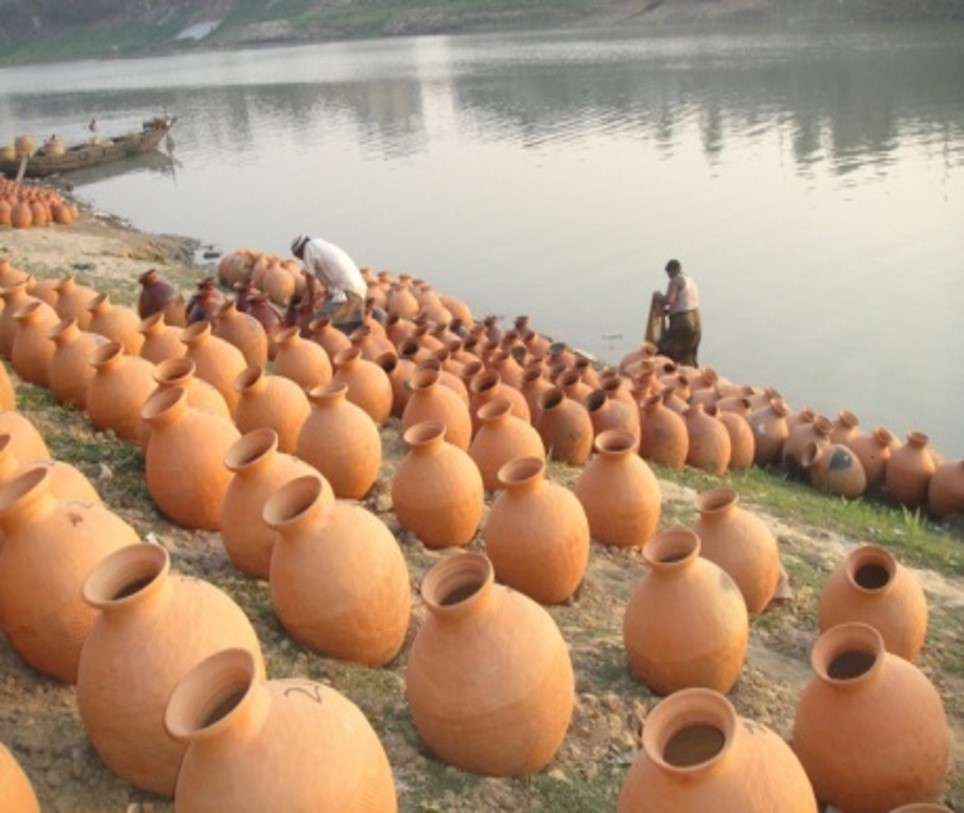
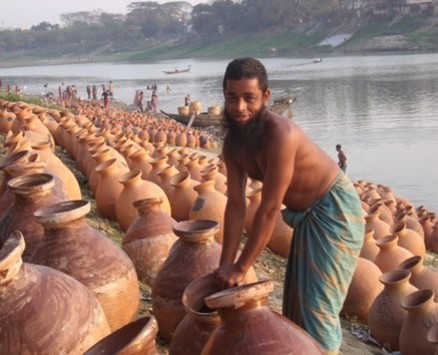
| 15:03, 15 July 2021 | Fermenting pot - motka.jpg (file) |  |
126 KB | Uploaded a work by Ben Belton from Submitted by author for inclusion in the "Visualizing Social Economies" video presentation. with UploadWizard | 1 |
| 15:07, 15 July 2021 | Fermenting fish being soaked with punti oil.jpg (file) |  |
47 KB | Uploaded a work by Ben Belton from Submitted by author for inclusion in the "Visualizing Social Economies" video presentation. with UploadWizard | 1 |
| 15:15, 15 July 2021 | Fermented punti (dried barb).jpg (file) | .jpg) |
51 KB | Uploaded a work by Mostafa A.R. Hossain from Submitted by author for inclusion in the "Visualizing Social Economies" video presentation. with UploadWizard | 1 |
| 15:17, 15 July 2021 | Fermented phaisa (anchovy).jpg (file) | .jpg) |
41 KB | Uploaded a work by Mostafa A.R. Hossain from Submitted by author for inclusion in the "Visualizing Social Economies" video presentation. with UploadWizard | 1 |
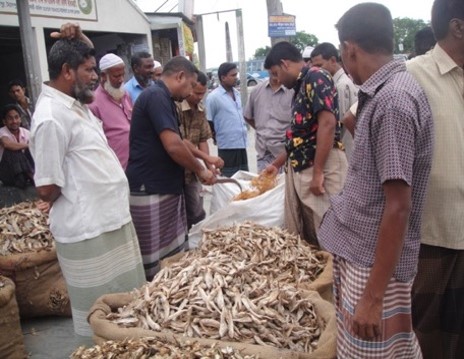
| 15:21, 15 July 2021 | Fish auction in Bangladesh.jpg (file) |  |
57 KB | Uploaded a work by Mostafa A.R. Hossain from Submitted by author for inclusion in the "Visualizing Social Economies" video presentation. with UploadWizard | 1 |
| 15:23, 15 July 2021 | Fish transport to retail market.jpg (file) | 45 KB | Uploaded a work by Mostafa A.R. Hossain from Submitted by author for inclusion in the "Visualizing Social Economies" video presentation. with UploadWizard | 1 | |
| 15:25, 15 July 2021 | Fish for retail in a Bangladesh market.jpg (file) |  |
58 KB | Uploaded a work by Mostafa A.R. Hossain from Submitted by author for inclusion in the "Visualizing Social Economies" video presentation. with UploadWizard | 1 |
| 15:27, 15 July 2021 | Bangladesh fish retail in market.jpg (file) |  |
63 KB | Uploaded a work by Mostafa A.R. Hossain from Submitted by author for inclusion in the "Visualizing Social Economies" video presentation. with UploadWizard | 1 |
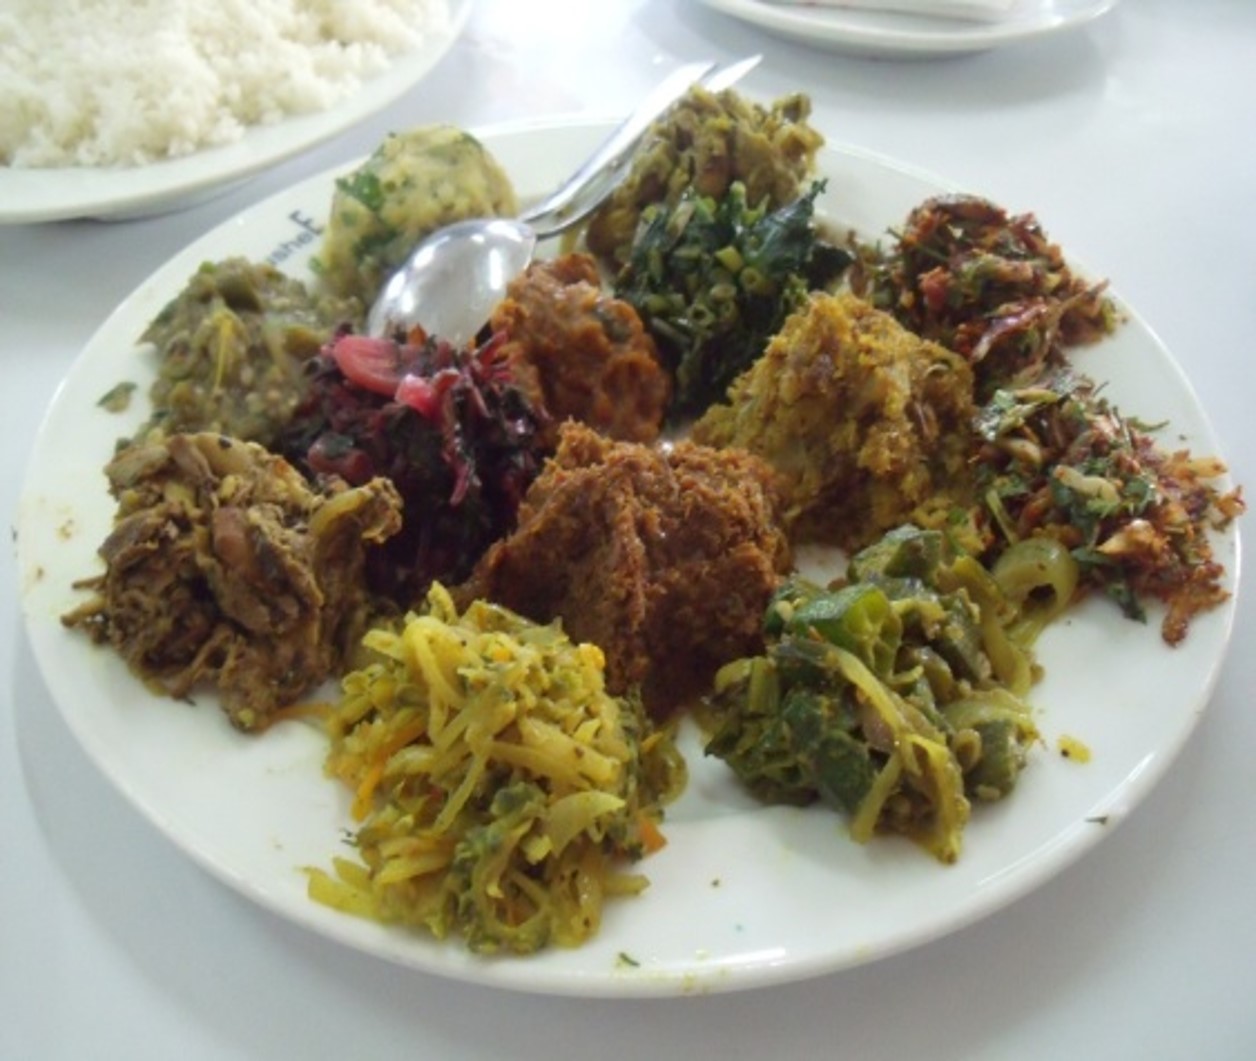
| 15:30, 15 July 2021 | Small plate of prepared dry and fermented fish.jpg (file) |  |
183 KB | Uploaded a work by Ben Belton from Submitted by author for inclusion in the "Visualizing Social Economies" video presentation. with UploadWizard | 1 |
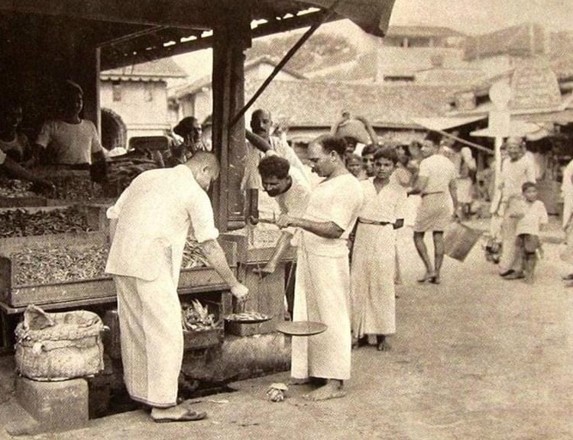
| 19:15, 28 July 2021 | Dried fish market, Pettah, Colombo, Ceylon, circa. 1940s.jpg (file) |  |
86 KB | Uploaded a work by Photographer unknown from Photo from Facebook Group ‘Old images of Ceylon’ with UploadWizard | 1 |
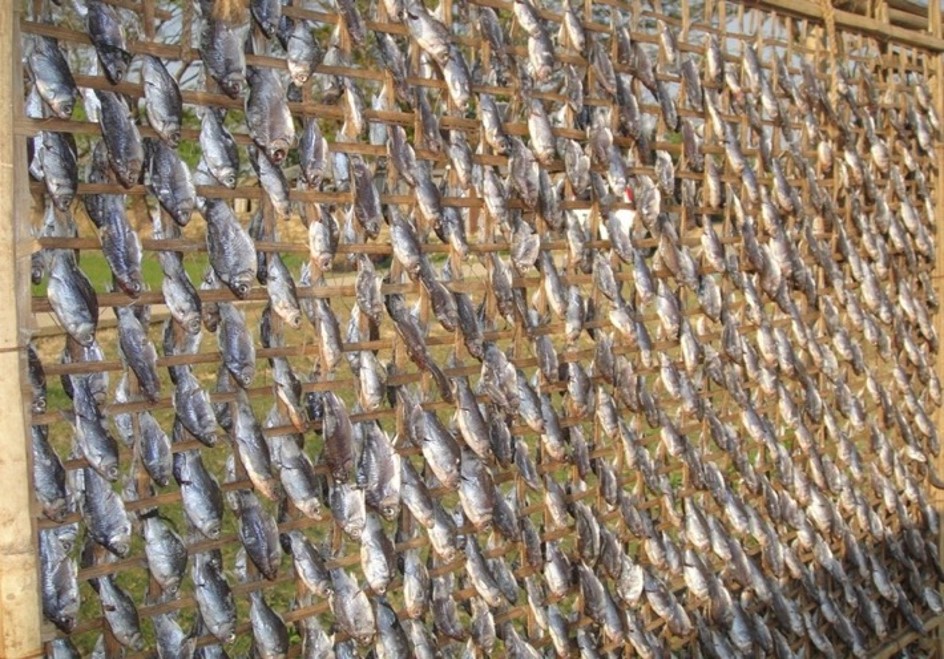
| 20:17, 28 July 2021 | Fish drying on hanging racks, Bangladesh.jpg (file) |  |
224 KB | Uploaded a work by Mostafa A.R. Hossain from Submitted by author for inclusion in the "Visualizing Social Economies" video presentation with UploadWizard | 1 |
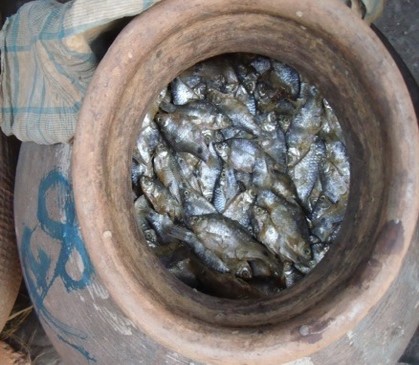
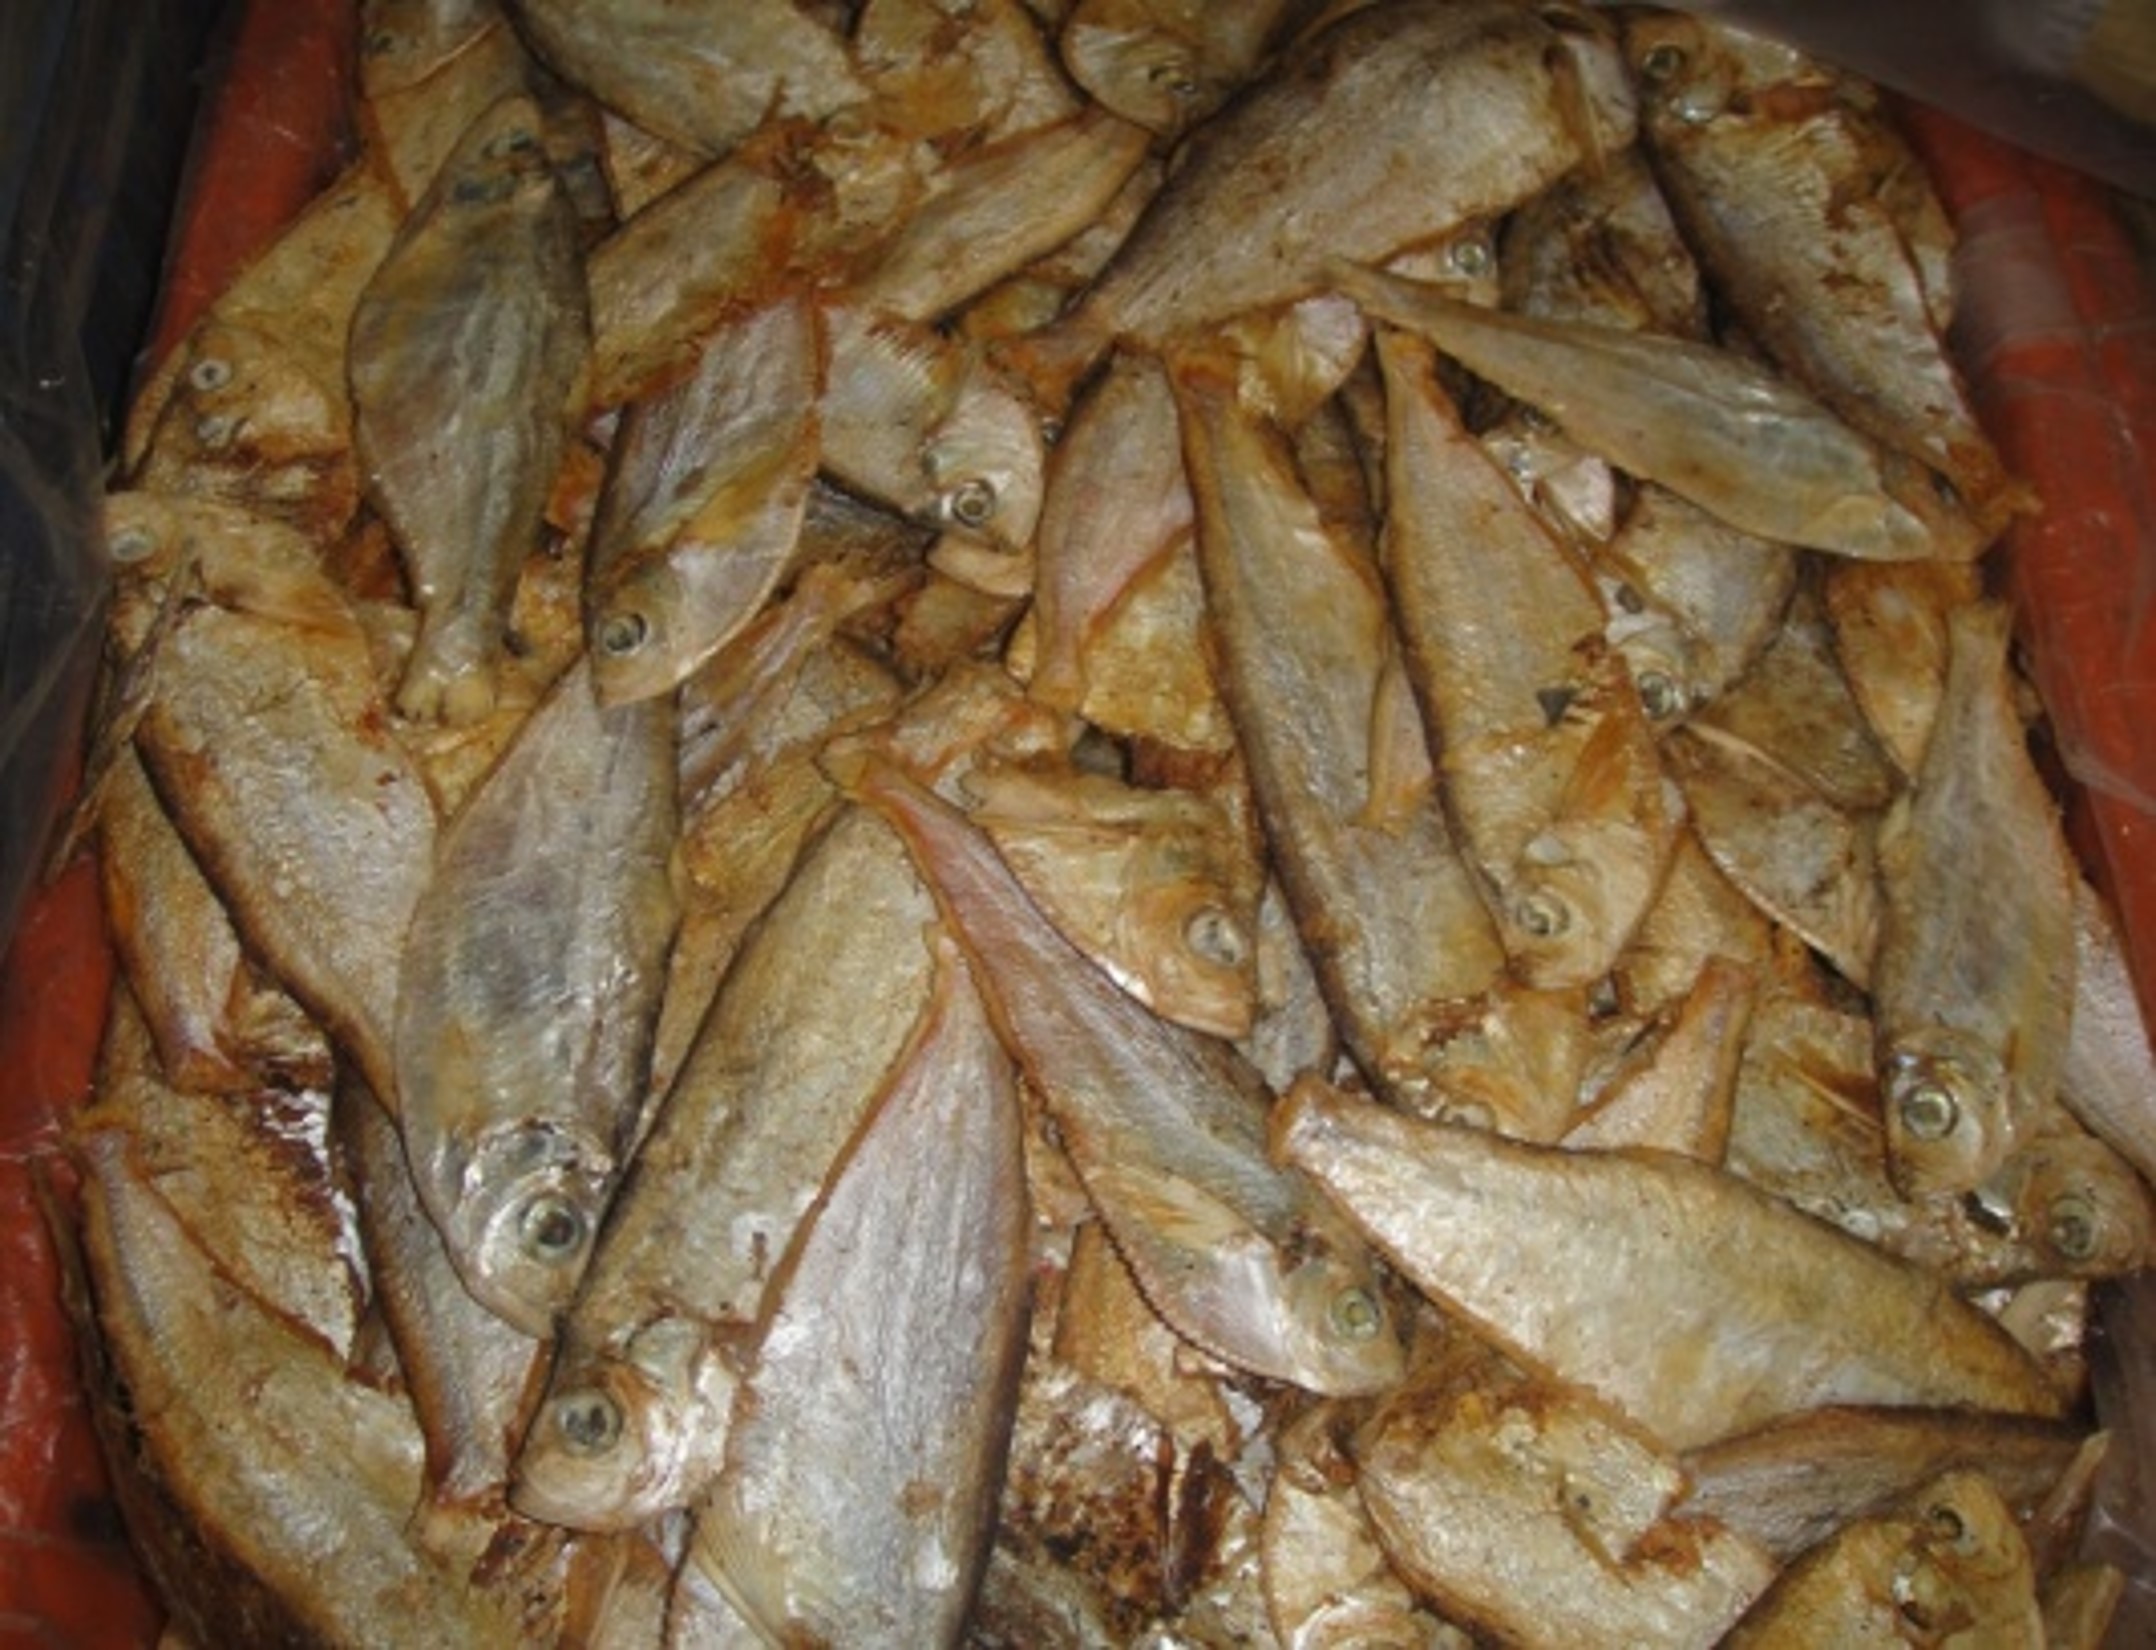
| 20:20, 28 July 2021 | Fermented fish, Bangladesh.jpg (file) |  |
499 KB | Uploaded a work by Mostafa A.R. Hossain from Submitted by author for inclusion in the "Visualizing Social Economies" video presentation with UploadWizard | 1 |
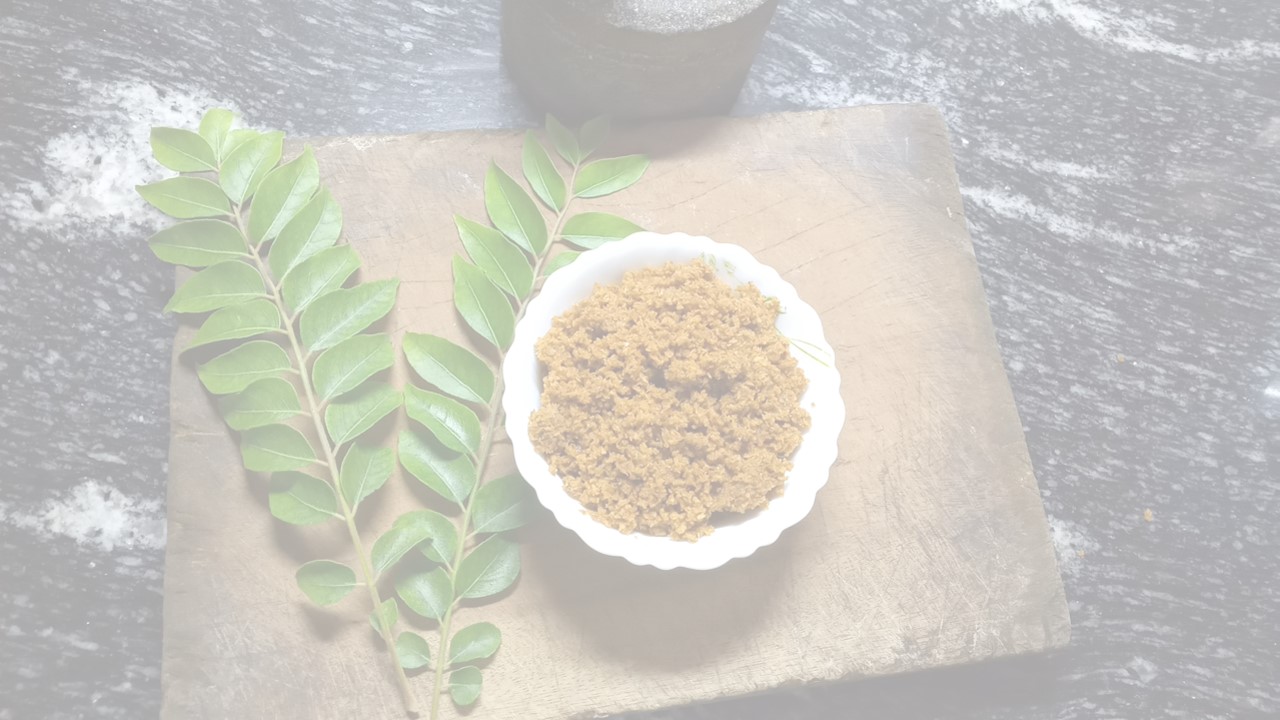
| 20:25, 28 July 2021 | Bowl of seasoning.jpg (file) |  |
167 KB | Uploaded a work by Nimitha Paul from Submitted by author for inclusion in the "Visualizing Social Economies" video presentation with UploadWizard | 1 |
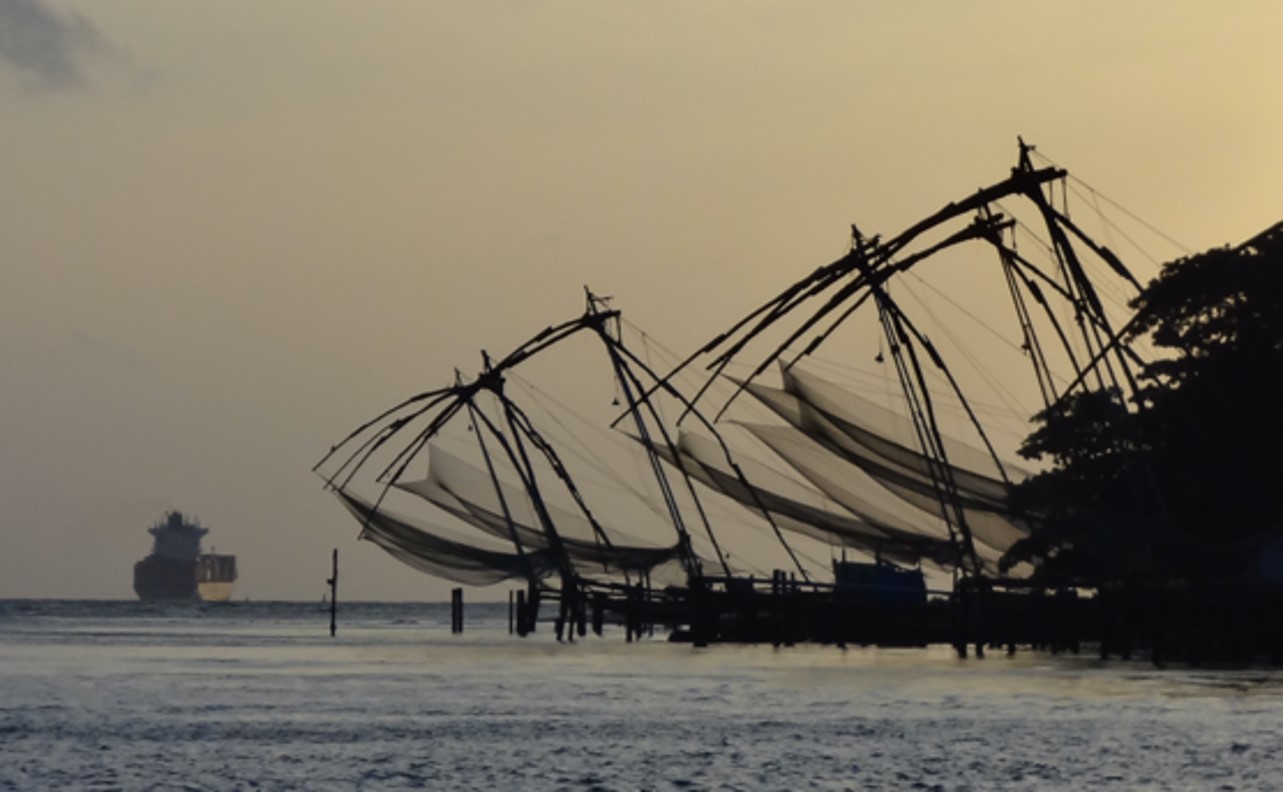
| 20:28, 28 July 2021 | Chinese dip nets in Kochi, Kerala, India.jpg (file) |  |
120 KB | Uploaded a work by Nireka Weeratunge from Submitted by author for inclusion in the "Visualizing Social Economies" video presentation with UploadWizard | 1 |
| 20:30, 28 July 2021 | Men working with Chinese dip nets in Kochi, Kerala, India.jpg (file) |  |
125 KB | Uploaded a work by Nireka Weeratunge from Submitted by author for inclusion in the "Visualizing Social Economies" video presentation with UploadWizard | 1 |
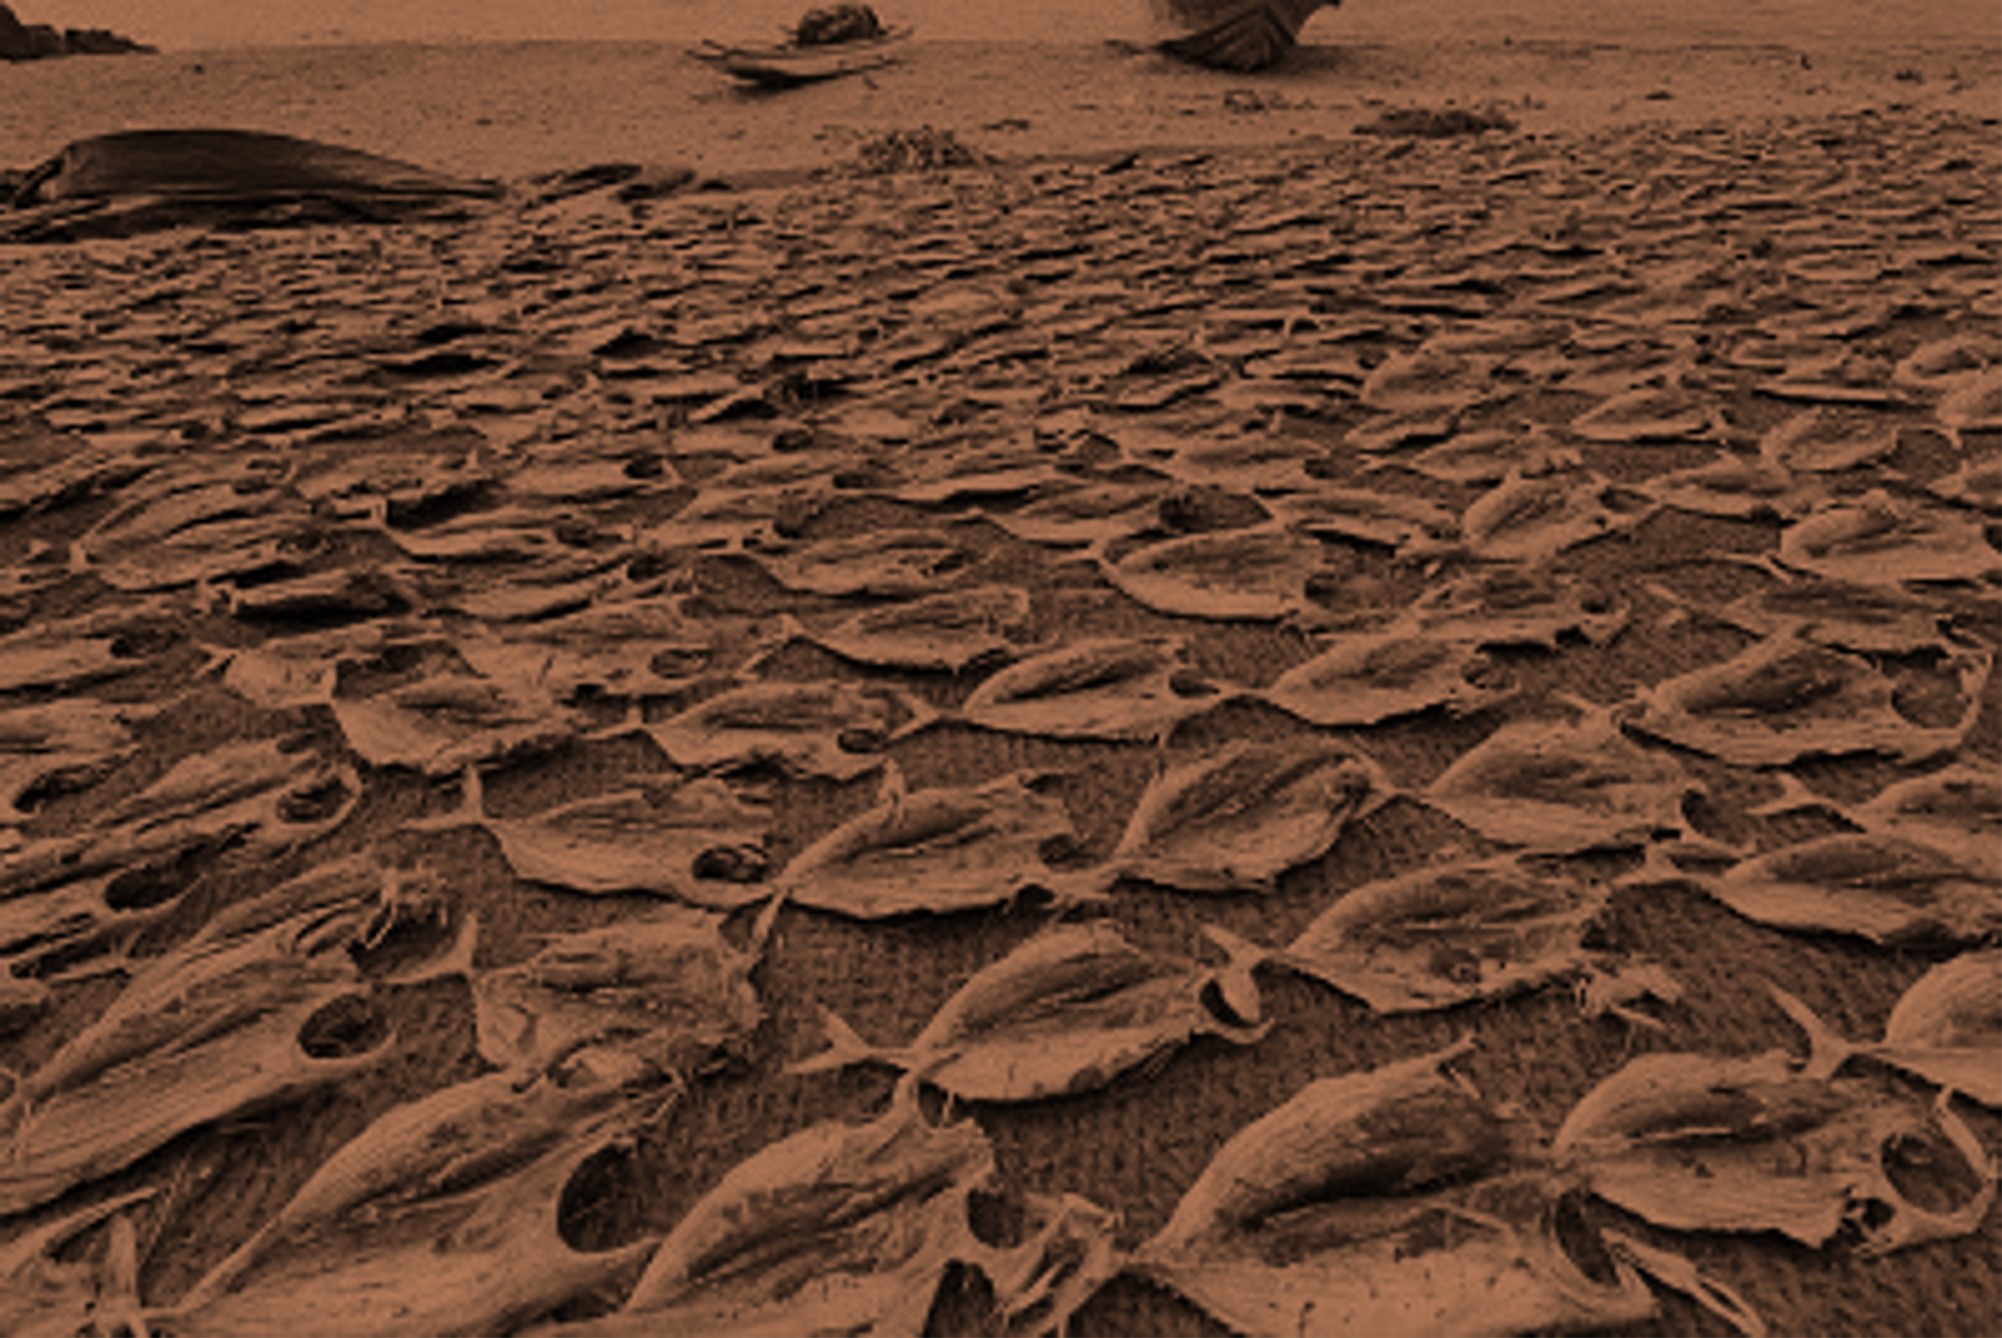
| 20:38, 28 July 2021 | Drying of fish, Negombo, Sri Lanka.jpg (file) |  |
500 KB | Uploaded a work by vuk8691 from https://www.gettyimages.ca/detail/photo/drying-of-fish-royalty-free-image/1212447819 with UploadWizard | 1 |
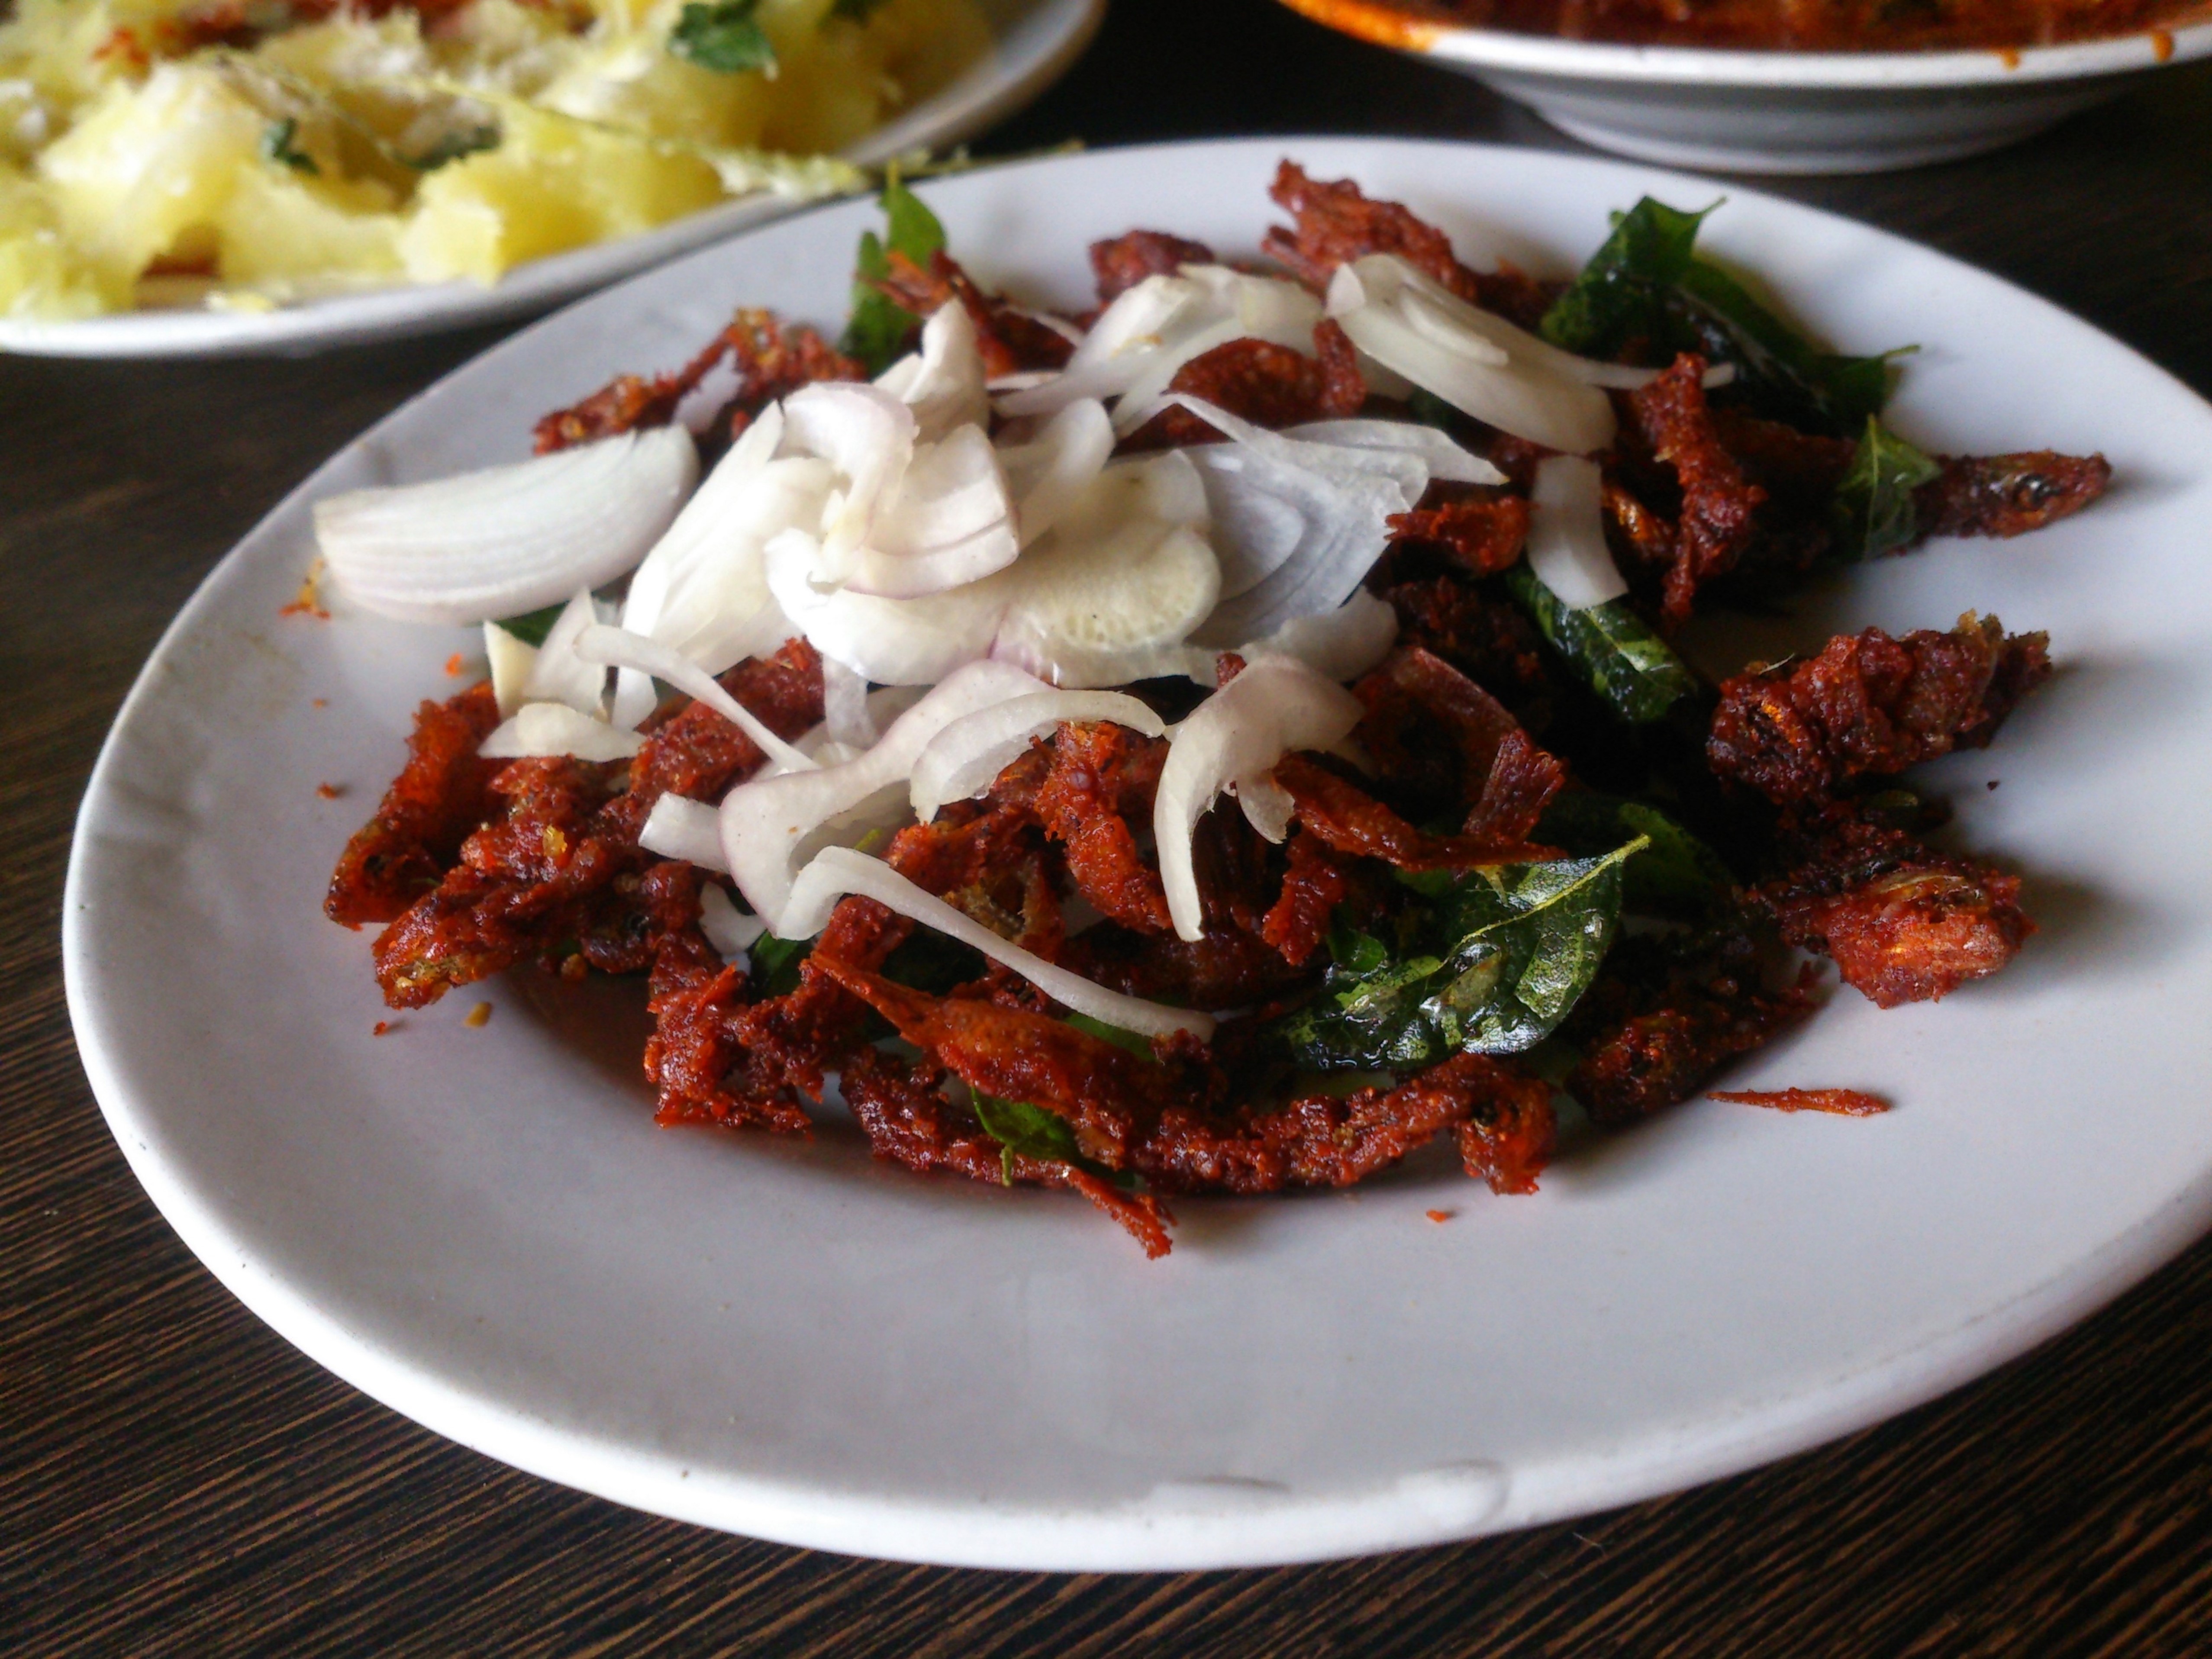
| 20:43, 28 July 2021 | Traditional Fish Fry.jpg (file) |  |
2.07 MB | Uploaded a work by Mathew Jibin from Wikimedia Commons with UploadWizard | 1 |
